Pull up your last five SQL Server incidents and count how many started the same way: a VPN client, a jump box, a Remote Desktop prompt, and a login screen, all before you had actually looked at anything. That sequence used to be the accepted cost of checking a server. It no longer has to be.
A growing number of SQL Server teams are moving day to day monitoring out of a Windows only console and into a browser tab. Not because the desktop console got worse. Because a browser removes a set of assumptions that never should have been there in the first place: that the person checking the server is on a Windows machine, on the corporate network, with a specific piece of software already installed.
Here is what is actually driving that shift, and what a browser based tool needs to get right before it can replace Remote Desktop instead of just supplementing it.
The RDP tax nobody put on a budget line
Every time you check a server through Remote Desktop, you pay a small tax. Connect to VPN if you are off the corporate network. Hop through a jump box if policy requires it. Launch the RDP session. Wait for the desktop to render. Then open the console you actually wanted to look at. On a good day that is two or three minutes. On a bad day, the VPN client needs an update first.
Two or three minutes does not sound like much until you multiply it by how often it happens. A DBA fielding ten “can you check server X” requests in a week spends the better part of an hour just getting to the point where the actual investigation can start.
There is a quieter cost too. Every RDP session is another authenticated connection into a production server, another line in a security review, another thing an auditor will eventually ask about. Cutting down how often that connection needs to happen is not only a convenience. It is fewer paths into the box that someone has to justify later.
Your team does not run on one operating system anymore
The assumption that every DBA sits at a Windows workstation is getting harder to defend. In MacStadium’s 2025 survey of 300 U.S. CIOs, 93 percent reported increased Apple device usage across their organization over the past two years, and 96 percent expect that investment to keep growing over the next two. Some of that is developers and executives, but infrastructure, platform, and operations teams are picking up Macs too, including the people who get paged when a database misbehaves.
A monitoring tool that only runs as a Windows desktop application quietly leaves part of your team at a disadvantage. It is not a dramatic failure. It just means the on-call DBA on a MacBook has one more hurdle than the one on a Windows laptop, at the exact moment speed matters most. The same problem shows up for Linux-based engineers, contractors on personal machines, and anyone troubleshooting from a device that was never provisioned as a SQL Server workstation in the first place.
A browser does not care what operating system it is running on. That is most of the point.
Real time is the bar now, not a nice to have
Web based consoles for SQL Server monitoring are not new. What has usually been missing is the ability to watch a server live, the way you would in a full desktop console. A web view that only reflects the last collection cycle is fine for a morning check-in. It is not enough when someone tells you the application is slow right now and you need to see what the server is doing this second, not five minutes ago.
This is the detail that decides whether a browser based tool can actually replace Remote Desktop or only supplement it. A historical dashboard answers “what happened.” Real time monitoring answers “what is happening,” and that second question is the one DBAs actually get paged for.
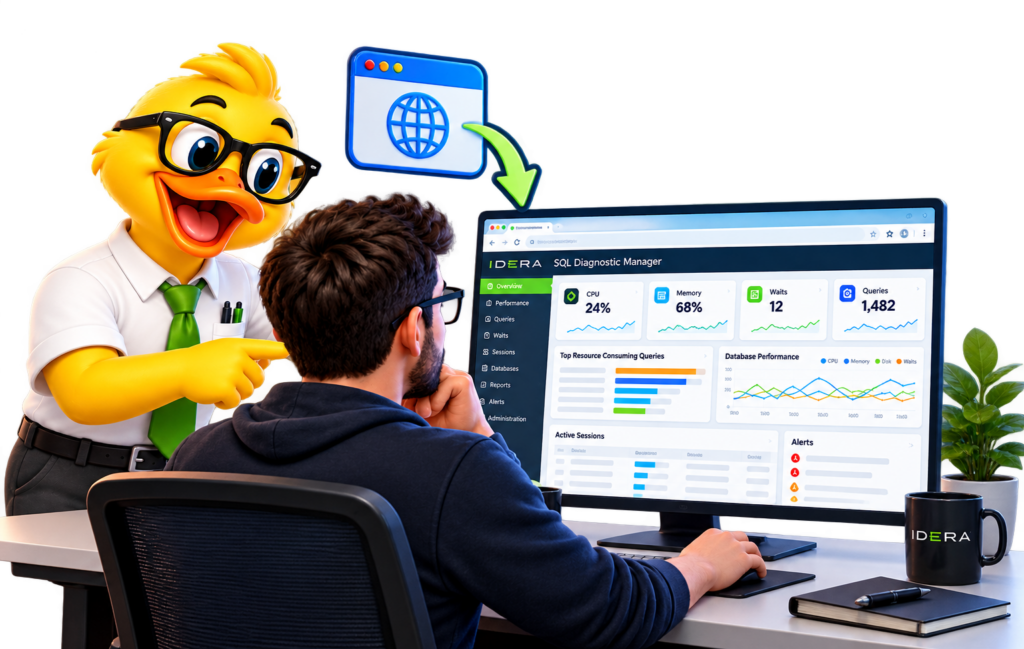
Real-time instance monitoring view running inside a browser window, with live session activity
A link travels further than a screenshot
When you find something worth showing someone, a browser based view changes how you share it. A screenshot is a moment in time. By the time it lands in a chat message, the data behind it may already look different. A link to a live view stays live. The application owner, your manager, or the DBA taking over on the next shift can open the same page and see the same thing you are seeing, updated in real time, without you exporting anything or starting a screen share.
For distributed teams, especially ones spanning time zones or handing off on-call coverage at shift change, that difference matters more than it sounds like it should. It turns “let me grab a screenshot and send it over” into “here, take a look,” and it removes a step from almost every incident.
Desktop console only
Real-time browser console
Works on macOS or Linux
No
Yes
Requires VPN and RDP for a quick check
Yes
No
Shareable as a live link
No
Yes
Reflects activity as it happens
Yes, once connected
Yes
Opens a new authenticated session per check
Yes
No
What a browser based console actually has to get right
Plenty of tools claim to offer web based monitoring. The ones that actually replace a desktop console, rather than sitting alongside it as a secondary view, tend to share a short list of requirements:
Real time monitoring of an individual server, not only historical data from the last collection cycle
Coverage of the screens a DBA actually reaches for during an investigation: queries, sessions, lock waits, lock statistics, and database statistics
Support for any modern browser on any operating system, not a subset of features gated behind a specific OS
No requirement to open a direct network path to the server for every person who needs to look at it
The same depth of information a desktop console would show, not a simplified summary that raises more questions than it answers
Measured against that list, most “web console” claims turn out to be a historical dashboard with a login page. The bar for actually replacing Remote Desktop is higher, and it is worth checking any tool against it before assuming the browser version can carry the same workload as the desktop one.
SQL Diagnostic Manager 14.3 brings real-time monitoring to the browser
SQL Diagnostic Manager 14.3 adds real-time instance monitoring to the Web Console, a capability that was previously available only in the Windows Console. You can now watch a single SQL Server live from any browser, on any operating system, without waiting for the next collection cycle and without opening a Remote Desktop session first. Combined with the Web Console’s existing coverage of queries, sessions, lock waits, lock statistics, and database statistics, it covers the day to day investigation work a DBA actually does, not just a summary view.
In early feedback on the 14.3 preview, James Fuqua at Vantage pointed to the Web Console as one of the parts of the release he was most enthusiastic about, describing how he already relies on it for quick, cross-platform access and for sharing information with the rest of his team without a screenshot in between.
Frequently asked questions
Can I monitor SQL Server without using Remote Desktop? Yes. SQL Diagnostic Manager’s Web Console runs in a browser on any operating system and, as of 14.3, includes real-time monitoring of an individual instance, so day to day checks no longer require a Remote Desktop session.
Does the Web Console work on macOS and Linux, not just Windows? Yes. Because it runs in a browser rather than as a Windows desktop application, the Web Console works on macOS and Linux the same way it works on Windows.
Is Web Console monitoring real time, or based on a collection cycle? Both, depending on what you need. Reports and historical views reflect your normal collection cycle. As of SQL Diagnostic Manager 14.3, you can also open a real-time view of an individual server and watch activity as it happens.