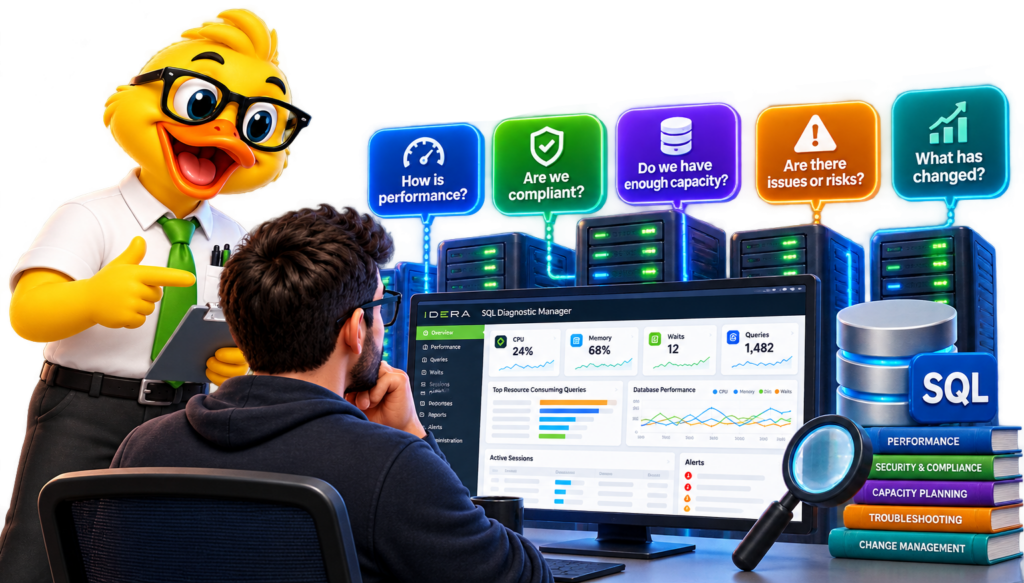
A director stops by your desk and asks a simple question: which of your two hundred SQL Servers is closest to running out of disk space this quarter. You know the answer exists somewhere. It is scattered across two hundred sets of collection jobs, a spreadsheet someone updated in March, and the memory of whichever DBA looked at that server last.
That gap between the question and the answer is the real measure of a healthy SQL Server estate. Not whether you monitor your servers. Almost everyone does that now. The real test is whether you can answer a handful of specific questions about your entire environment without opening a single server, running a single query, or waiting for someone to get back from lunch.
Here are five questions worth asking your own environment today.
1. Which queries are costing you the most, right now, across every server?
Most teams can answer this for one server. Open Query Monitor, sort by CPU or duration, find the usual suspects. The harder version of this question is the one that actually matters at budget and planning time: across every server you run, which five queries would give you the most performance back if you fixed them first.
Without an estate-wide view, answering that means opening every instance, sorting the same way, and building a spreadsheet by hand. It is slow enough that most teams only do it once a quarter, if that.
Example: a batch job that runs fine on every server except one starts eating CPU every Tuesday afternoon. If you can only see one server at a time, you find that pattern when someone complains. If you can rank query cost across the whole estate, you see it Wednesday morning, before it becomes a ticket.
Enterprise Top Queries report, sorted by CPU or duration, spanning a server group rather than a single instance.
2. Where is blocking happening, and who is it actually hurting?
Blocking is one of those problems that is obvious once you are looking at it and invisible everywhere else. A session holds a lock, three more sessions queue up behind it, and by the time anyone notices, the finance team has already opened a ticket about a report that “just hangs.”
The question is not whether blocking happens. It happens somewhere in your estate most days. The question is whether you can see it happening, on the server it is happening on, and trace it back to the specific query and session causing it, rather than a vague sense that “something is slow again.”
Example: a nightly ETL job blocks a reporting query for six minutes every night at 2 a.m. Nobody notices, because nobody is awake at 2 a.m. Six months later, the report owner finally escalates it. The evidence needed to solve it was available the entire time. It just was not visible to anyone who was looking.
Deadlock or blocking chain visualization showing the head blocker and the sessions waiting behind it.
An Enterprise Blocking Report that rolls this up across a server group turns “which server is it this time” into a ranked list, updated automatically, with duration and blocked session counts already sorted for you.
3. What is actually slow: the query, the wait, or something upstream entirely?
“The application is slow” is not a diagnosis. It is a starting point. The actual cause could be a poorly written query, a missing index, a busy disk, another session holding a lock, or TempDB contention that has nothing to do with the query anyone is currently staring at.
Wait statistics are how you tell those apart. Microsoft’s ownsys.dm_os_wait_stats documentation is worth bookmarking if wait analysis is not already second nature on your team, since almost every performance investigation eventually comes back to understanding what SQL Server was actually waiting on.
The estate-wide version of this question is where it gets genuinely useful: not just what one server is waiting on, but where your whole environment is spending its time. If three servers are all waiting heavily on the same wait type, that is not three separate incidents. That is one pattern with one root cause.
Query waits by database.
Query waits by user
4. Which databases are about to become a capacity problem?
Every DBA has had the conversation that starts with “we ran out of space” and ends with an emergency purchase order. It is avoidable, but only if the growth trend was visible before the disk filled up rather than after.
The useful version of this question looks forward: given the last six months of growth, which databases in your estate will need attention in the next ninety days, and which ones can wait. That is a data question, not a guess, and it is the difference between a planned storage request and a page at 2 a.m.
Example: a database growing at four percent a month looks fine today and looks like an incident in five months if nobody is tracking the trend. Forecasting from your own collected history turns that into a line on a chart instead of a surprise on a Friday.
Enterprise Top Databases
Query waits by database
5. Could your team answer any of this without a remote desktop session?
This last question is less about data and more about access. If the only way to check a server is to open a Windows machine, connect to a jump box, and launch a console, your ability to answer the first four questions depends on someone being at a specific desk with specific access at a specific time.
That is a real constraint for on-call rotations, for DBAs working from a Mac, and for anyone who needs to hand a colleague a link instead of a screen-share invite. A real-time view that runs in a browser, on any operating system, changes who can answer these questions and how fast they can do it.
Example: an on-call DBA gets paged at 11 p.m., opens a browser on a laptop, and watches live activity on the affected server without a VPN client, a remote desktop session, or a Windows machine anywhere in sight.
Real-Time instance view running in browser window.
Why one server at a time stops working
None of these five questions are new. DBAs have always cared about expensive queries, blocking, waits, capacity, and access. What has changed is the number of servers sitting behind each question. A technique that works fine for five servers falls apart at fifty, and an environment of two hundred servers needs a fundamentally different way to ask these questions: across the estate, not one instance at a time.
Answering these five questions with SQL Diagnostic Manager 14.3
SQL Diagnostic Manager 14.3 was built around exactly this shift, from investigating one server to understanding an entire estate.
Five new Enterprise Reports (Top Queries, Blocking, Query Wait Statistics, Top Databases, and Server Resources) answer questions one through four for a whole server group in a single report, instead of a separate trip to every instance. A modernized console and reporting experience makes the answers easier to read once you have them. AI-powered query and index optimization inside Query Monitor gives you a starting point for fixing what you find, with every recommendation reviewed and approved by a DBA before anything changes in your environment. Real-time monitoring in the Web Console answers question five directly: watch a server live from any browser, on any operating system, without a remote desktop session first.
If your own environment could not answer all five questions this morning, that gap is worth closing before the next incident makes the case for you.
Frequently asked questions
What does “SQL Server estate monitoring” actually mean? It means monitoring and reporting across every SQL Server in your environment as a group, not investigating servers one at a time. An estate can be five servers or two thousand; the questions in this post apply either way.
How is an estate-wide report different from a single-server dashboard? A single-server dashboard answers a question for one instance. An estate-wide report, like SQL Diagnostic Manager’s Enterprise Reports, answers the same question for an entire server group at once, ranked and sorted so the servers that need attention rise to the top.
Does the AI query optimization in SQL Diagnostic Manager apply changes automatically? No. Recommendations are generated for review, compared side by side against the original query, and require a DBA’s approval before anything is applied. No table data is sent to the AI feature, and the capability is disabled by default until an administrator turns it on.
Already a SQL Diagnostic Manager customer?Upgrade to 14.3 through the Idera Customer Portal to put the new Enterprise Reports, the modernized console, and real-time Web Console monitoring to work in your environment now.