


Transcript
00:46
SQL Server Availability Groups
Today we’re going to be talking about how we can keep your SQL Server running smoothly, specifically looking at performance problems. We’re also going to talk about some of the new features that we have built into SQL Diagnostic Manager specifically for troubleshooting availability groups.
01:03
SQL Diagnostic Manager
We have a few different options on how you can use or how you can monitor your availability groups within SQL Diagnostic Manager. Now, I know everyone’s muted, but we do have a question piece in the Go to Webinar and you are welcome to type in any question. I will try my hardest to get to that part of the discussion sometime within the hour of this demo.
So, like I said, this is not really going to be a marketing webinar. This is more of the long lines of what you can practically see or what you can try to diagnose or use SQL Diagnostic Manager to monitor your SQL environment.
So a few things to note. Obviously, when we think about SQL Diagnostic Manager, there are a lot of different offerings from different companies, but this is an ideal offering for monitoring and how to verify the status of your SQL instances.
01:56
Cloud Virtual Machines
When we talk about your SQL environment with regards to SQL Diagnostic Manager, it’s also important to note that this tool can work on on-prem SQL instances. It can monitor VMs. Whether we’re talking about VMs that are running in VMware or VMs that are running in HyperV, this can also monitor pretty much any VM within the cloud. If you have virtual machines that are out in AWS or in Azure, we can certainly monitor them as well. As long as, of course, you have access to our permissions.
Going further, if you have RDS databases of service, databases of service from Azure, managed instances in Azure, or elastic pools, all of these types of SQL instances that are in your environment can be managed centrally from a tool like SQL Diagnostic Manager. Cloud offerings can be monitored as well as on-prem and VM.
02:57
SQL Server Deadlock
If we’re talking about trying to make sure that your environment runs smoothly, first and foremost we have to make sure that we’re monitoring a lot of different KPIs and metrics with regard to your SQL environment.
Everything from when your last backup occurred to running out of space. If your data files are running out of space, if you want to look at blocking, if you want to look at deadlocking, and again if you have disaster recovery technologies, availability groups, or replication, for that matter. Mirroring. Not that very many people do that anymore. I think the jury is not out on this case. Everyone’s pretty much moving to availability groups. Even so, also going a step further, we know that most SQL instances that are in the cloud are automatically or pretty quickly running on Availability Groups.
03:57
There are a lot of different aspects of features that we need to look at to monitor successfully in any given SQL environment.
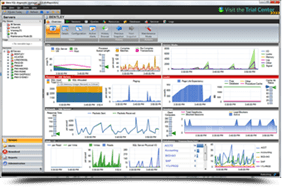
Let’s imagine I’ve got SQL Diagnostic Manager. I have in this case a small environment of nine different instances that I’m monitoring. How do I go about monitoring, or how does the process of monitoring work? How do I make sure that the metrics I’m monitoring are set correctly and are set specifically for how my SQL instances are used?
SQL Server Monitoring
Again, let’s imagine I’m in front of this tool and I want to start monitoring a SQL instance. Well, the first thing I’m going to do is, of course, add that SQL instance. Now, when you’re adding a SQL instance in Diagnostic Manager, you’re going to give it a connection and you can use either Windows authentication or SQL authentication to connect to it. Now, specifically for Availability Groups, you have a few different options.
04:56
SQL Server Availability Groups
One of the options is that you could monitor the listener instead of each individual SQL instance, you could just monitor the listener of the Availability group. Now, one of the advantages of that is, of course, you’re not going to consume. Let’s say you had a four-node Availability group cluster. If you were monitoring just the listener, that would only consume one license. That’s cost-saving and can be helpful.
You can also just monitor the SQL instances themselves. And that’s fine too. Of course, using my same example, if I had a four-node cluster, I would consume four licenses in that type of configuration. So that’s obviously more money to consider. The other thing to mention is that if you’re monitoring just the listener, you can actually see the whole topology of your Availability Group and verify that it’s running effectively.
06:03
SQL Server Instances
Now, once we connect, and again we can connect to the listener, we can connect to the SQL instances themselves. What we do at IDERA is start by applying a template. A template is really a starting point for monitoring.
This tool comes with about five different templates out of the gate. If you want to look at the templates that are available…You’ll obviously have a default. It looks like I’ve got six different specific templates, but I’ve got a default template which is really my go-to. I’ve got a critical-only template which is really tied to a QA, a high-performance template, and then I’ve got templates specific to database as a service, and a template specific to managed instances.
Now, if you ever want to edit the template or see what you’re monitoring looking at the template, you just hit View Edit and you can go to the Edit configuration section to see what’s available for monitoring.
07:02
SQL Server Metrics
This is the list of the metrics that we’re monitoring by default when you add on a template. Now, a few things to note. Looking at this, you can see that I’m monitoring for backups. You can see I’ve got custom counters. You can see a whole slew of metrics specific to availability groups. Estimated data loss, role change, redo Rate, redo Q, all these types of metrics are monitored within SQL Diagnostic Manager.
Now, it’s also important to know that’s a default monitoring. As I add a SQL Server into SQL Diagnostic Manager, this is already going to be turned on. We’re going to already be monitoring for the health of the underlying availability group that you’re running on.
Another thing that I would mention is that the template is the starting point.
07:57
You don’t have to go back to the template and make adjustments to it. It’s really just applied to a SQL instance. Let me jump out of this template and go to the actual monitored instance and look at that as opposed to looking at the template.
SQL Server Health
Here, I’m looking at my nine SQL instances. The instances that need attention have red X’s on them. If I hold my cursor over the red X, I’ll get a pop-up telling me why that SQL Server is not running really well. In this case, in one of my SQL instances, Eval AG 2, the redo Log synchronization rate has been reduced. You can see that I’m already monitoring the health of the availability group underneath this SQL instance.
Now I’m going to go into a server and just pick Configure Alerts and you’re going to see that this looks almost exactly like the template right now.
08:52
The reason why I bring this up is, like I said, this template was a starting point. This turned on the metrics for this specific server. I can then go in and make adjustments to those metrics. The reason why I bring this up is when we’re talking about monitoring your SQL environment and making sure that it runs smoothly, it’s important to monitor for the right metrics and it’s important that the metrics are keyed in correctly for how you use your SQL environment. Right?
A few things I’d like to mention here is when you look at these metrics, for example, you’ll see that a lot of times they seem to repeat. Like for example here’s the availability group’s estimated data loss in seconds. Right underneath it, we’ve got availability group estimated data loss in seconds underscore baseline. So what’s the main difference here? Well, a few things to note are some of the metrics that we have are hard coded.
09:45
Let me just look at this top one. This is a hard-coded metric that’s figuring out the amount in seconds of data loss, right? We’ve got a hard-coded number of 900 as a warning condition, and a hard-coded number is 1800 as a critical condition. This is not going to change based on the way you use your availability if it’s going to already be preset. Underneath that, you can see that there is the same metric except it says underscore baseline. Now, what’s the difference?
Baselining
Well, in this case, we are going to automatically adjust based on the baselining capabilities within SQL Diagnostic Manager to make this metric more accurate for how you’re using your SQL instances.
Let’s talk about how that works or how that baselining works. Once the SQL instance has been added, SQL Diagnostic Manager will automatically start to try to figure out what’s normal or what the normal performance is for that SQL Server.
10:46
Dynamic Baseline
It does that using a process called baselining. We have two different ways that we can run a baseline. We can run a dynamic baseline, which means it’s continuously changing based on the last seven days of work.
Static Baseline
Or you can do a custom or static baseline, which means if you want to baseline off of a certain week of the month or a certain month out of the year, you could do that when we’re baselining.
Baseline Configuration
What are we doing? In this case, I’m looking at this Columbia Server for any specific metric we’re averaging and then adding and subtracting one standard deviation to give you what’s called a reference range, or a range that we think is where you standardly perform. We’re trying to figure out where you standardly perform.
Now, a lot of times people will say, okay, so you’re doing that Monday to Friday, eight to five.
11:43
SQL Server ETL
What happens when my SQL instance is running its ETL process in the middle of the night, or it’s running its maintenance, or doing its maintenance in the middle of the night? Or maybe I have a different kind of workload that happens at different periods of time.
Well, one of the things you can do with this tool is you can actually put in a main period of time to baseline, but you can also go in and put in secondary and tertiary periods of time to account for other processes that might be happening.
Let’s imagine that during the day you have a normal workload that’s not very hectic, but in the middle of the night you do have a very high I O load that happens on this SQL instance. Well, if I account for that by putting these periods of time into the baseline configuration, and by the way, you can apply that baseline configuration to all your SQL instances as needed.
12:41
Let’s imagine I’ve put in all those different periods of time. Now if I go back to the metrics that I’m monitoring, this makes more sense. The availability group estimated data loss underscore baseline would adjust based on what that workload was in the middle of the night versus in the day.
Just to clarify what these numbers mean over on the right, what we’re saying here is that when you get to 100% of the reference range of the baseline, that would be a warning condition. If I went to 20% above that would be a critical condition. The takeaway is that I’ll smooth out my alerts and I won’t be getting tons of email notifications about problems that aren’t necessarily problems, right? What I’ll have is instead metrics that make sense for how my SQL instances are actually performing.
Again, one of the things I think is important to note is that when you’re talking about monitoring, it’s important to get the SQL instances themselves into good condition.
13:45
For example, when you’re looking at all your servers, you want to see them all with green checkboxes so that if a server degrades or goes into a warning condition or goes into a critical condition, you can pick up on it pretty easily.
SQL Server Performance Metrics
A few other things to mention about the metrics that we’re monitoring and I’m going to go through the whole list–well, not the whole list–but I’m going to skip through a little some of the areas and just touch on them. Of course, we’re looking at backups. We’ve got specific metrics for availability groups, database size, auto growth monitored file groups, mirror status, tempdb monitored, and index fragmentation monitored as well. We have specific metrics for database of the service as well.
One of the things I wanted to highlight just really quickly on this is of a different subject is that in SQL Diagnostic Manager we are looking at correctly sizing your database as a service environment.
14:44
Database as a Service
If you have a database as a service and you’re underutilizing it, we’ll let you know. Or if you have a database as a service that’s being overly taxed or being pushed pretty hard. We’ll also let you know if you need to change your tier or add resources using our metrics as I scroll down. We also have operational metrics, we have metrics around resources, and specifically, we have monitoring for page life expectancy and services.
SQL Agent Jobs
If you’re looking at your SQL Agent jobs, if you’re looking at Cluster failover, if you’re looking for blocking or deadlocking, all these different metrics are monitored within SQL Diagnostic Manager. Again, we do tie in with the virtual environment so we can monitor the underlying host.
Now, if you have any metrics that are noisy or are causing a lot of alerts that’ll be popped up, there’ll be a recommendation for adjusting the metrics.
15:54
You can take these recommendations or not, it’s entirely up to you, but we try to make it easy for you to make any adjustments specifically to your metrics. We don’t want to have you overthink it. And this is just me personally. I think that if you’re using the underscore baseline metrics, you’re going to have more accurate information.
SQL Server Availability FAQ
Okay, so a few little questions came into play. One question is about the ranking that’s listed here. The ranking is interesting, but some people take advantage of it, and some people don’t. It’s an optional feature in the sense it just puts a value on your given metrics. For example, if a database goes offline, that might be a higher-ranked problem. A warning condition like a critical CPU running at 75% might be a less valuable alert. What we’re saying is that there are different levels of alerts and some are more important or scarier at any given time.
17:03
SQL Server Alerting
Looking at this, like I said, you can put in different ranks in the alerting component, and I’m going to talk about that in a sec. In the alerting component specifically, you can put in things like you can tell SQL Diagnostic Manager to take any metric that has a rank of zero to 30 and send it to one group of people. Whereas you might want to say any metric that had a value from 30 to 70 goes to another set of people.
Even going one more step further, you could say the highest level of Lurch goes directly to my DBA. That’s why we put the ranking in here.
A few more questions here. Let’s see, we will cover the monitoring of replication and availability groups and mirroring. I’ll show you where you can see that in the product. Oh, this is a very good question.
18:00
Do you make changes to or can you put the recommendations into place on an individual server or on a template? That’s a great question.
First and foremost, I think that the most important thing is to tailor the metrics to your specific environment. In typical environments nowadays, you can see people having we do monitor SQL 2000 through 2019, but usually, the oldest that I ever hear about is 2008. What we can all say is that if you’re thinking about being an It from 2008 until now, a lot of things have changed. If the environment is configured poorly, or if you didn’t have much memory, or you didn’t have much CPU, you might have a SQL Server out there that’s just underperforming, right? You need to make exceptions for all those different SQL instances.
Let’s imagine that of my nine instances, I want to monitor for CLR being turned on in this one box.
19:08
Or actually, let’s pick something different. Let’s pick disk free space by size. Well, the template would have applied all these options and turned on or turned off everything. If I select this link, what am I doing? Well, I’m making that change on this one server, I’m turning on this metric on this one server. When I apply that, for example, if I hit apply over here, SQL Diagnostic Manager will say, hey, did you want to make that change anywhere else? If I say yes, I have the option to make that change on all servers. Sure, I can make that change on specific servers that are grouped in what we call tags. Over here on the left is some examples of tags. If I want to turn on or turn off something, or if I want to make that change and have it added to the default template, so going forward it’s automatically incorporated as I add SQL instances.
19:59
I could do that as well by putting that into the template. There are a lot of different options, but typically, like I said, the templates are a starting point. You make the changes and customizations on any given server and you can make lots of different very niche changes.
For example, if you want to put metrics down to an individual hard drive, you can certainly do that. If you want to monitor for SQL Agent jobs, but you only want to monitor some specific jobs, not all the jobs, you can actually filter that. Or if you want to put Thresholds down on specific databases, you can do that as well.
Okay, we still have a few more questions. Let me go through that really quickly. Okay, a nice question to talk about is alerting. Let’s go into the alerting part. Note that these are all the metrics that we’re monitoring.
21:00
SQL Server Monitoring Alerts
Just because we’re monitoring terms doesn’t necessarily mean an email notification will be sent out. You have to configure and tell SQL Diagnostic Manager or your monitoring tool. What’s important now in my thought process on monitoring SQL instances is I want to monitor and have all these metrics, all this history and all this information kept, so that I have lots of good information to troubleshoot after the fact. I want all this information kept, but I don’t necessarily want every email notification. My example for that might be this. I want to monitor the health of availability groups for all these different statistics. Maybe I only want to be emailed. Yeah, maybe I only want to be emailed when a role change happens.
Well, the thing that’s nice about a tool like this is that you can really customize and get this configured the way you want it to be configured.
21:54
SQL Diagnostic Manager
I can have all this information and data being held. Obviously, that’s helpful if, for example, I want to look at a specific server and maybe I want to go back to a certain period of time. Here’s the 19th, 1138, and now I’m going back to that point in time. I wanted to monitor for all that information and have this information in or history in SQL Diagnostic Manager, but I don’t necessarily want to get emailed on all of them.
How you set up your email is entirely up to you. Let me go over here, I’m going to go to the tools section and I’m going to go to Alert Actions and Responses. Now we call this alert, Actions and Responses because you can actually, instead of just sending out email notifications, you can pre-program in lots of different responses that can react when something happens, right?
22:44
For example, maybe I want to run a PowerShell command and initiate a role change of an availability group when certain criteria are met. I can do that. By the way, I can also add in a custom counter, so I could have a custom counter built in that was counting and putting on counting any specific metric. I could have a reaction set up in SQL Diagnostic Manager as far as changing. Again, we can fire off emails that are built in, but you can also run any T-SQL script, which is a pretty powerful option. You can run your own jobs or have certain jobs execute. You can interact with System Center, you can kick off program exe or batch files.
I think the most powerful option here is that I can run a PowerShell command that just gives you a lot of different options as far as a reaction. Let’s start by talking about the specific question I got, which is how do I not get too many email notifications?
23:45
Again, if you’ve got the metric set to underscore baseline, the tool should figure out pretty quickly what’s normal operating parameters and what’s not. In my case, what I do in SQL Diagnostic Manager is I start off by adding my email notifications or alerts, and I separate these out based on the day of the week and the hour of the day. Here are my work hours and email alerts, and you can see that I went in and it’s a three-step way of setting up alerts. You add the conditions, add the actions, and down here you fine-tune the rule. Looking at this, I went in and said Monday to Friday, 7am to 6pm. These are my work hours and I want to be alerted to these specific metrics. If I click on that, you can see that I paired down the metrics that I wanted to get alerted on. Specifically, I went into the availability group metrics and it only said to send me an email and synchronization health changes or role changes.
Now, one of the questions was how do I make sure I’m not getting email notifications continuously or having them bombarded? One of the conditions you can set within SQL Diagnostic Manager, by the way, here is that ranked option. If I wanted to have the email notifications sent by a rank to certain people, I could do that. You can also have it set where the metrics severity has changed. Here you can see this where metric severity is changing. If I have this checkbox turned on, then I won’t get an email notification every polling interval. Instead, I’ll only get an email notification when a server changes its status. It goes from good to a warning. That would be a change of status.
25:40
It goes from warning to critical. That’d be a change in status. It would only generate one email notification or one alert. Looking at that, when I look at metric severity changing, that was one of the questions we had. Again, I want to break up my email alerting based on the hour of the day and day of the week. Here’s my weekend rule again, I can go in here and I can put in my conditions. What are the conditions I want to look at? Well, Saturday and Sunday I only care about the servers that are in production or this tag. I put that in and I only care about these specific metrics. The takeaway with this is that you can get the alerts that you want while not being bombarded by alerts that you don’t necessarily care about. One of the things that is the double-edged sword of monitoring, in my opinion, is that if you start getting too many email notifications, you’ll stop paying attention to them.
26:33
That’s just something that we’re aware of and it’s important to address.
Okay, so let’s also keep on going more and talk about some of the other things you can expect to see or get SQL Diagnostic Manager to do. Again, we’re talking about all these different action providers. An example of that might be maybe if there’s a blocking problem, I want to automatically kill the lead blocker. You can do those kinds of things with this tool. Or maybe you want to rebuild indexes when they’re fragmented, or maybe you want to run an analysis and get recommendations for different things you can do to make your SQL instance run more effectively. We do have a recommendations tool that can help you rewrite queries and give you tuning options and make your SQL instances run more effectively. This is tied to one of our offerings called SQL Diagnostic Manager Pro.
27:21
We also have a wait state analysis component that’s also tied to that SQL Diagnostic Manager Pro. I’ll try to get to this as well.
Let’s go back, I’ve got a bunch of questions, so I’m going to go back and go through them really quickly.
Okay, so there was a specific question about jobs running long and we’ll have to take that one offline because it’s specific to your environment. What I would say is you can make exceptions for specific jobs on different SQL instances. If you are monitoring an availability group and you’re just monitoring the listener, then as the role changes, for example, if my primary node went to a secondary tertiary node, the baseline, the options would be different. If you’re just monitoring the listener, then the baseline statistics will probably be thrown off. In a perfect world, you usually would want to monitor the underlying SQL instance as opposed to monitoring the listener specifically.
28:46
SQL Server VM
Okay, so the next question was, can we monitor SQL instances as well as still collect information on-prem instances as well as cloud instances? And the answer is yes. The only thing that I will say is the caveat is SQL Diagnostic Manager needs a full VM to run. You wouldn’t be able to run this on a managed instance, for example, or database as a service. You would be able to monitor, on the other hand, a managed instance or a database as a service, but you wouldn’t necessarily, like I said, be able to run SQL Diagnostic Manager fully on the cloud like on a database as a service scenario.
Availability Group
Okay, so let’s move forward. Let’s talk about what you can expect to see when you’re looking at an availability group specifically. Or let’s talk about the different areas that you can go to in Diagnostic Manager to look at things like replication or mirroring or whatnot.
29:48
Here you can see I’m on this Columbia server. We saw the metrics that we’re monitoring. This is my dashboard or overview section. It does have details about the SQL instance itself. It does have a configuration page. If you want to make changes to the configuration, you can adjust your underlying SQL instance and then there’s a timeline.
One of the areas that I think is important to note is that you can actually go over to the databases tab and here you’ll find that there’s a dedicated view for availability groups.
Now one of the things I think is important to note is that you can see this drop-down. This server, for example, Columbia, does not have an availability group on it. If I want to go to a server that does, I’m going to switch over to this Eval AG 2. So here we go. I click on that and move over to that SQL instance.
30:37
Now I’m in the same view on the secondary instance. And you’ll note that there is a dedicated view for availability groups.
Down at the bottom here we’ve got the transfer rates, redo and log, and the queue size redo and log, and you can see the health of the availability group.
Now if I was just monitoring the listener, this would still show up, even the secondaries would show up and you could get an idea of what’s going on even if I’m monitoring the listener. I think we’ve established the best ways to monitor the instance itself. But here’s the dedicated view for that. Again, all these graphs within the tool are expandable, they’re all printable, you can all you can pull them out of the tool pretty easily.
SQL Server History
Another thing to mention is that you do have a history browser here. If I wanted to go back, I don’t know if I was connected to this box on the 12th, but let’s just go look and see here.
31:30
I’m going to look at the 12th at 1127 and yeah, I’ve gone back in history and now I’m looking at that same availability group. One of the big advantages I think is that you do have this history or this information available to you because you have a monitoring tool, and you have a nice big history available for the availability group. You can go back and troubleshoot a problem after the fact.
SQL Server Database Mirroring
Another thing to mention is like I said, there’s a dedicated view for mirroring. I don’t have any mirroring so it’s boring to look here but you can see the status and whatnot if you had it running. There also is another area that’s buried for just standard replication. If I was going over to services over here, I could go over to Replication.
32:20
SQL Server Replication
Here you can see and again, I don’t have any Replication running, but you could see the publisher, distributor and subscriber of any given replication that was in your environment. Switching gears and just again, talking about the availability group and talking about what you can expect to see.
SQL Server Reporting
One of the areas that I think is going to be very helpful is the reports piece of Diagnostic Manager. Here I’m going to again switch gears, and go back to this reports area. Note that in Diagnostic Manager this comes pre-populated with a bunch of different reports right out of the gate. You’ve got monitoring reports, analysis reports and planning for the future. One thing I will say is that you can run these reports from within the tool, but you can also push them or hit deploy reports and push them out to reporting services. An example of that would be over here I can look at all these top reports in SQL Diagnostic Manager.
33:13
SQL Server Availability Group Statistics Report
One of the reports that sometimes people miss is the Availability Group Statistics Report. Looking at this, let’s say I wanted to look at the overall health of an Availability Group. Well, I could actually go in here and I’m going to look at all tags. I’m going to pick an Availability Group, and I only have one, and I’ll pick a time period. Let’s say I want to go back 30 days. Now, mind you, I haven’t been connected or not I’ve been connected, but I’ve also disconnected from this Availability Group a few times in my environment. There might be some holes in my reports, but here I’m going to go back 30 days on the sample by day. Over here it’s going to ask for the chart. Now it’s important to note that these are all the different metrics that you can expect to see in the details beneath.
34:10
It’s going to show all these metrics, but it’s only going to show one chart. Here I’m going to do the review rate and I’ll hit run report, and now the report is being run. Here we go, here’s the review rate. It’s actually really boring in my environment, but if I scroll down, I have all the rest of these statistics. Average review rate, average redo queue size, all that’s listed and all the specifics around that availability group.
Okay, so let’s see, we had a whole bunch of more questions real quick. That’s an interesting question, very specific.
SQL Server Cloud Migration
There’s a specific question about how do I keep my on-prem information if I’m migrating to the cloud? There are a few ways to do that. You could migrate the SQL Diagnostic Manager database out to a VM in the cloud, and then you would have their history. You could also decommission Diagnostic Manager over here and then still have the database available.
35:21
You could go through the database and look through the history tied to Diagnostic Manager. The third option I would say is coming up pretty shortly: we’re going to have scaling where you can have multiple installations of SQL Diagnostic Manager and you can use one console to look at all the information and history. That should help with that specific question. Like I said, if you have two different installations of SQL Diagnostic Manager, you pretty shortly should be able to view them all.
Okay, so now, let’s see, so replication is monitored. Even if you don’t have a subscriber, you’re still going to get the monitoring of replication, even if instances are not added to Diagnostic Manager.
Let’s see, so the question I had was from getting a bunch of alerts or email notifications about a problem and I’m trying to diagnose it, what options do I have available to try to figure out what’s going on or why those alerts are being generated?
36:47
There’s a lot here for doing that. Let me just preface this by saying if you were getting alerts on the redo rate or redo log synchronization or something like that, and you wanted to get more information about what you wanted to get recommendations for, and how to make that run more effectively. Just consider that you can always point SQL Diagnostic Manager to a SQL instance. Every one of the instances that have been added to Diagnostic Manager has an analysis component.
Let me switch over to a server where I’ve run analysis. Here we go. Let’s say I’m getting alerts right now and I’m trying to get ideas for different things I can run. Well, I can run an analysis and this gives you recommendations for a variety of different areas. I can look at activity and resource configuration. The big one I think is that you can look at the workload, so you can look at index optimization and query optimization.
37:44
That’s probably what I would focus on. I run the analysis and I would typically run that analysis while I was getting an alert or an error. I’ll get good real-world things or ideas I can use to make that SQL instance run more effectively.
SQL Server Recommendations
Now just to go through some of the recommendations that you might get. I’m going to go to Properties really quickly. Under each individual server, the property section shows you all the different information about a sequel instance, but the analysis configuration is the bottom piece. Note that you can run analysis when needed, but you can also run it in a scheduled format and you can also run it as an alert action response. You could say when certain criteria are met, no matter what the time, I want to run an analysis. But to go into and see all the different recommendations that are available, you just go into advanced settings and I’m going to hit block recommendations. I’m not going to block anything.
38:42
This gives you a list of all the different recommendations that are going to be run against your instance and some of the ones are going to come back telling you things that you can do differently.
SQL Server Query Optimization
Now let’s imagine what I’m really trying to do is figure out how to run a specific query more effectively because I found that a certain query is really affecting my availability group and really bringing me down pretty quickly. How do I go about doing that? Again, we’ve got the recommendations piece in Diagnostic Manager, but we also have, like I said, SQL query tuner, which is part of SQL Diagnostic Manager pro.
Two things to note here, and I’m not going to go over it too much because it’s really off-topic, is that we can go in here and profile SQL instance. This profile is using the DMV, so it’s very low impact.
39:30
SQL Server Applications
You can also go in and filter by specific application or database. If I was having a problem with my availability, I might look at that database specifically to see which queries are running against it. Once I found a query, I can right-click on it here and I could say, okay, Explain Plan, or I could say, Tune. If I hit Tune, which I’ve already done in the background, it will actually take this query out, bring it over to a tuning job, and we’ll try to rerun it and make it more effective.
So a few things to note here. I’ve got this select statement that’s running or ran, and it took about zero 76 seconds to run with SQL Query Tuner. We did a detailed analysis and we ran this and we came back with a lot of different ways we could rerun this select.
40:23
Now, an important thing to note: if I hit Perform Detailed Analysis, it’s actually going to run this query a bunch of different times and give you the statistics. If you’re doing a select, that’s one thing because you’re just viewing data. If I do perform detailed analysis and it’s an update, you are updating. You’re effectively making changes on the SQL Server to the data. So that’s something to be aware of.
SQL Server Query Tuner
Now, when we’re running Query Tuner, we’re going to find a bunch of losers like down here, but we’re also going to find some ways to run the query that is going to be more effective. Here you can see this query took 76 seconds, and down here you can say I got it to run in 0.25.
Now if I want to compare, I can just right-click on and say compare to parent. This brings up both queries and I can see the differences between one or the other and see what changes we’re making to make this run more effectively.
41:15
SQL Server Workloads
Also, note that in the Query Tuner, we can run workloads. If you wanted to verify that the rewrote query was running more effectively, you could actually open a new workload section, give the SQL Query Tuner the parameters of how you want to run that query, and then hit this little play button and you’re off to the races. They’ll be running in the background, trying to figure out what that workload looked like at a really active crowd.
OS Metrics
There’s a question about OS Metrics in it being available or not available. This is a very interesting thing to consider. So why would that be? Well, when we’re monitoring and this is a specific SQL Server when I’m connected to it. Let’s say I’m over here and I right-click and go to Properties. How you pick up your Windows metrics is entirely up to you by default.
42:22
Over here, under OS Metrics, we’re going to use the Service account and we’re going to be trying to connect via WMI. If you’re connected to the listener that might not necessarily go through to get the WMI part, but when you’re connected to the SQL instance, it probably will because you have more permissions. Here the thing I would do is if I was monitoring via the listener as I might turn on automation so that I got the information that way instead of getting WMI directly from the operating system.
SQL Server Query Monitor
All right, next question is really great question coming in. It’s talking about capturing information with Query Monitor. We haven’t gotten into that part of the tool yet. If you’re looking at any given server and again I’m on this Columbia Server and I go over to the queries piece of SQL Diagnostic Manager is turned off by default.
43:18
You have the query monitor that you can have turned on and then you have query weights. Now the question is about impact and if there’s a better way to capture information.
Looking at this, when you’re looking at Query Monitor, and this is how I look at my long-running queries, typically when you have a query monitor turned on, it’s going to give you signature mode, statement mode and query history. These three tabs will start to load up with data.
The particular question is about, like I said, impact. Going into Query Monitor, when I have this enabled, you can decide how you want to pick up information. We have trace if you have a really old 2005 box or something like that, sure, we don’t want to use that. Typically you have extended events. This is the default that most people go with. You’ll notice that it’s got an estimated plan and an actual plan.
44:06
I would only capture the actual plan if I was filtered in specifically to what I’m trying to tune right, that’s when I look at the actual plan. The question is what’s the best way? By far the best way is to pick up Query Store or use Query Store.
Query Store
There’s a caveat here. The caveat is that if I start to use Query Monitor and I’ve got this turned on and I’m trying to pick up via Query Store, obviously Query Store has to be turned on by default and it’s not turned on by default. You might have to go through your SQL instances and turn on Query Store on any given database and have it configured. There’s a really great video out there from past, I can’t remember the presenter’s name, I should have been more prepared, sorry about that. She talks about configuring Query Monitor and it’s a very interesting video and I think you can get it on YouTube.
44:59
Okay, so still looking at this, the best way is to use Query Store. I’ll also tell you another side note, if you’re monitoring a database as a service, or if you’re monitoring managed instance, a lot of times Query Store is turned on by default. Or it’s a very easy selection to have Query Store turned on.
Now, my thought process about Query Store is it looks like the video that we’re talking about was from Erin Stiletto. The big advantage I think of a Query Store is that you can pick up a lot more information,= and put way lower thresholds because Query Store is picking up everything and you already have the impact associated with it. There’s no more impact that’s going to be added if you have Query Monitor turned on.
Query Wait
Now, the other area to look at is query waits. Now, I think query waits is a great part of this tool.
46:01
If I was using SQL Diagnostic Manager, I would put a lot of stock in the query waits piece. Now, here’s what I would like to suggest. First off, if you want to use Query Store, consider having it turned on to collect indefinitely like I’ve got.
Another big thing to note here is if you have Query Store, then you can use it, no problem. I don’t think I would use extended events. If you have a choice to use the query waits piece, you want to opt out of using extended events if you have it turned on this way. I’ve got this collecting turned on and collect and definitely turned on. It’s going to pick up all the information using DMVs and that’s very low impact, so it’s very helpful.
Now, what information is it picking up? Well, it’s picking up the wait states, but it’s also picking up the associated statements, the application, the database, the client, the session and the users.
46:57
That’s a lot of great information.
Now, why I bring this up is if you have this turned on all the time and you want to let’s say I’m looking at here’s the 25th, and I want to go back to, let’s say, 03:00 in the morning. If I have query waits turned on all the time, it’s pretty easy for me to jump back to that period of time and see what was going on using the wait piece of the tool.
Now, the last thing to mention is you can see the workload that is associated with that. I can see here are the waits, but also what application was causing this, and of course, this is my backup or its compliance, actually, and which database was being hit, what client, session and users.
47:55
It gives you a lot of great information for troubleshooting and trying to figure out what’s going on.
All right, let’s see. That was the query piece in SQL Diagnostic Manager. I know we’re down to our last ten minutes in this discussion. It did cover the metrics and I did cover the analysis. One of the areas I think is overlooked a lot is the session piece. Let’s just cover that really quickly here.
SQL Server Blocking
I’m in the queries piece. I’m going to back out of that area and go back to the overview. Let’s imagine that I had a blocking problem and I want to get more information about that. Well, again, if I’m on the all servers view, if I hold my cursor over any red indicator, I can get an idea. There are some deadlocks and some blocking is going on. Now I want to get more information about it.
48:42
I’ll double-click on this thumbnail and it takes me to the dashboard. Down here is where the blocking is. I want to get to the next level and I want to click on this and it will take me into a deep review.
So here I’m an overview. I’ll click on this graph and it will jump me into the blocking chart. Actually, the first place it usually jumps me to is the summary. I’ve got a graph down here that shows me my block sessions. If I click on that graph, it takes me to blocking. I can see the blocking chain.
SQL Server Activity Monitor
There’s an interesting thing that I want to talk about, and it’s about the Activity Monitor that’s built into Diagnostic Manager. One of the things that people, when you, let’s say you’re getting this installed and configured, a lot of times people will ask, well, how often am I polling that sequence and what’s the total impact of that?
49:44
Okay, give me 1 second, I can get to that question in a second. Okay, one of the things that’s important to note is that if I’m looking at a server and I went to its properties, there’s a general polling interval, right? The general polling interval by default is once every six minutes. I’ve set my polling interval down to once every two minutes.
Now, there’s also an activity section. Every 30 seconds, Diagnostic Manager will reach out to any given SQL instance and it will run a very small query against a known table to get a specific piece of data back. That happens every 30 seconds. So what’s that doing for me? Well, it’s verifying that the network is up and running and it’s verifying that the SQL Server is up and running and that it’s responsive. So that happens every 30 seconds.
Now, if this polling interval is at the default once every six minutes, a lot of times people will say, so if you have a blocking problem, does that mean that your blocking might have to happen up to six minutes before I’m made aware of it?
50:46
SQL Server Extended Events
And the answer to that is no. Notice that I’m in the general section. If you go a few down, you’ll see the Activity Monitor. If I jump into the Activity Monitor when I have this enabled, and in this case, you do want to use Extended Events, but when I have the Activity Monitor enabled, I’m going to be looking for deadlocks, auto growth and blocking even in between polling intervals. If I have this turned off, I would still be looking for deadlocks. I would still be looking for blocking, but it would only be during the polling interval. If I have this turned on, it’s in between the polling interval.
Blocking in SQL Server
Now, the question was specifically about thresholds of blocking. Some blocking happens by default. Typically, if blocking happens, you want to be aware of a problem after it’s happened for a short period of time. Now, on older SQL instances, the default that we sent out for blocking threshold was 30 seconds. On newer SQL instances and newer installations, we’ve changed that default down to 5 seconds. If a blocking problem happens for less than 5 seconds, we typically think of that isn’t something to worry about. Again, two different thresholds we’ve gone with older servers, 30 seconds. Newer servers, 5 seconds.
Okay, so the activity monitor will pick up blocking in between polling intervals. If I want to look at that blocking, I can go over to the Sessions piece, look at the blocking chain, and then let’s say I want to kill this blocking. Well, I could right-click on this and kill the session here.
Deadlock in SQL Server
Or maybe I want to know about Deadlock history or blocking reports. I can double-click on this Deadlock reports section and it’ll show me which session was killed and the information associated with it. And then that’s of course, exportable.
52:38
If I want to pull it out to share it with anyone else, I can pull that out pretty easily. I’m going to switch gears for a split second because there was a question about the history for blocking and deadlocking and how I would go about looking at it. The answer to that is I’ll use the alerts view.
Let’s imagine this isn’t the first time this blocking problem has been happening, and I want to know more about how often it’s affecting this Columbia server. Well, if I go over to alerts by default, this shows me Active Alerts in the top right-hand corner, and this might behind your go-to meetings. Just be aware, Active Alerts just shows the problems that are currently happening.
Now, what if I want to know the history of blocking? Well, how do I do that? I turn on show all the alerts for a certain timeline.
53:21
Now, let’s say I want to go look from the 15th today. So ten days. If I hit apply, this is going to find all the alerts across all the servers, and it’s going to be a bunch of different information. I’m just waiting for this to come back. I did ask for a lot of information from SQL Diagnostic Manager, so bear with me on it, but wow, this is really taking a long time. Well, heck, I guess I’ll come back to it. What I would say is that you can go under the alerts view. I guess I did ask for a lot of information. Okay. Here what I would do is I would go in and look under the active alerts in the time span. I would just go over here, give it a time span, then pick the metric, and the metric will be blocking or deadlocking.
54:36
That’s how I would get the history for any of those that information. Sorry everyone, bear with me. This is taking a long time and let me get out of that and just bring it back up. I apologize. Okay, so, and we’ve got five more minutes. If anyone has any questions, this is the time to throw them into the chat piece for me to make sure to get to that question. Let’s try this alert one more time and see how well I do.
Okay, so we’re going to switch to active alerts. I’m just going to give it the three days and I’m going to go look at a specific metric blocking because I did ask for a lot of here’s blocking. So I’ll hit apply. Now I found all the blocking problems across that instance. Note that I’ve turned on grouping so I can say group by box and I can say I want to see all the blocking based on instance.
55:30
And I have 2125 block processes. One of the things that sweet about this are nice is that you can scroll down through a view. Here I’m going through all these blocking processes or alerts. If I wanted to investigate a specific one, I can click on that alert. The thing that I like the most is I can actually right-click on it and I can say show a historical view. In this case, it’s on the 24th on Columbia blocking problem. It’s going to take me to that server, to the blocking view, to the problem at hand. I think that you can get a lot of good information here.
Looking at the alert section. Again, if I right-click on it will take me back to that point in time. Also, if I want to look at all my deadlocks, let’s just look at that view really quickly.
56:29
So here I had 250. If I double-click on a deadlock, I’ll get the deadlock view. That shows me the spread, which session was killed, and which session survived. And of course, this is exportable information. So a lot of good intel.
Exporting SQL Server Data
Okay, so another question that just came up is how can we ingest information into another monitoring tool or how can I take the alert information from, let’s say, SQL Diagnostic Manager and push it into, let’s say Splunk or something else?
Now typically any other monitoring tool will accept a variety of different alerts. What I would usually alert, what I would say is there are a few options here. Under administration actually not under this little tools thing. If I went back to alert actions and Responses, remember that there are a lot of different responses available. If you have System Center, we can automatically have a specific alert to connect or integrate System Center with SQL Diagnostic Manager.
57:45
Let’s imagine I don’t, I’m looking at Splunk and I want to have this information go well, you could always fire an email to pretty much any other alert platform and it should pick it up.
Another thing that’s available is SNMP. That’s an older technology, but we do have traps. So an alert is generated. If you wanted to have an S and MVP traps sent out to another console, you could certainly do that.
A third way you could maybe integrate is that you can post information to the event log and then usually lots of other alerting tools can scrape the logs to ingest those alerts into the other solution or integrate them into a different solution.
Okay, so let’s see, we are at the top of the hour. That was our 1-hour little run. Let me see if I can answer any other questions. Very interesting question.
58:49
SQL Server Migration
Can we use ingested new baseline information from a server that was on-prem to maybe use it on a different server or on a migrated server? The answer I would say to that is there are a few different options.
SQL Server Configuration
Let’s say I’m looking at a specific server. I’m going to look at this Columbia server. I’m going to go to Properties. Note that your baseline configuration, let’s imagine you have a Premigrated SQL instance and you’re over here under the baseline section. You can apply the baseline configuration somewhere else, but that’s just the configuration, right?
Another thing that we can do is you can create a template off of an old SQL instance. Let’s imagine this server, Columbia, is the one I have on-prem and I’m trying to move it over to the cloud on a VM and I want to use its configuration or its baseline information to help me configure this cloud instance.
59:52
So how would I do that? Well, I would probably start off by going to the template section. Here I’m going to go to alert configuration template and I would say new. Down here you’ll say copy from and I can copy from a template, but I could also pick a server. Here’s Columbia, I’m going to copy from Columbia and I’m going to call this migrated server and there’ll be a new template. Now that I’ve got the migrated server up, I can push all this information out to that migrated instance.
SQL Server Statistics
Another thing that we can do if you’re trying to use the baseline statistics from something that’s on-prem is you could go to the alert section or report section. I’m pretty sure there are analysis report baseline statistics right here. You could run a report for the baseline statistics off of the server that was already on-prem, and then you could push it to the cloud.
01:00:49
Okay, so let’s see. What other questions? Well, that was our whole hour. Just as a side note, guys, this demo is being recorded. You’ll get a link in about an hour if you ever want to go over it. Another thing to mention is we do demos like this throughout the week, so keep an eye on your email. Maybe it’s an interesting topic that you want to look at or something like that. With that, I want to say thank you to everyone who attended, and I hope everyone has a great day.
Topics : Database Diagnostics,Database Monitoring,Database Performance,
Products : SQL Diagnostic Manager for SQL Server,
SQL Server High Availability
Database administrators need to reduce the impact of downtime when a disaster happens. SQL Diagnostic Manager is a powerful and comprehensive tool to ensure the availability, health, and performance performance of their SQL Server instances.
Watch this video to learn how to drill down into critical performance metrics, track queries and plans to fix blocks and locks, alert predictively and avoid false alerts, and view expert advice with executable scripts.
SQL Diagnostic Manager finds and fixes SQL Server performance problems in physical, virtual, and cloud environments – including managed cloud databases.
Learn about the top features and benefits of SQL Diagnostic Manager, and how to get started.
24X7 SQL performance monitoring, alerting and diagnostics
- Monitor performance for physical, virtual, and cloud environments.
- Monitor queries and query plans to see the causes of blocks and deadlocks.
- Monitor application transactions with SQL Workload Analysis add-on.
- View expert recommendations from SQL Doctor to optimize performance.
- Alert predictively with settings to avoid false alerts.
- View summary of top issues and alerts with the web console add-on.