SQL Server performance monitoring is mission-critical for database administrators and IT teams who need to keep systems optimized, secure, and compliant. With databases powering everything...
SQL Server performance monitoring is mission-critical for database administrators and IT teams who need to keep systems optimized, secure, and compliant. With databases powering everything from financial transactions to healthcare systems, even minor performance issues can have a major business impact. Having the right monitoring tool in place ensures you can spot issues early, diagnose root causes quickly, and keep downtime to a minimum.
In this article, we’ll walk through the top five SQL Server performance monitoring tools available today, outlining their key strengths, best use cases, and how they help DBAs and IT leaders run smoother environments:
IDERA SQL Diagnostic Manager
Quest Spotlight
ApexSQL Monitor
Redgate Monitor
SolarWinds SQL Sentry
For each tool, we’ll expand on: Best-fit scenarios, standout capabilities, reporting and compliance postures, and the tool’s limitations and trade-offs, so you know where each tool shines (and where it doesn’t).
By the end, you’ll have a clear picture of what’s out there and be able to make an informed decision on which of these five SQL Server Performance Monitoring Tools is best for you.
1. IDERA SQL Diagnostic Manager
IDERA SQL Diagnostic Manager is a SQL Server performance monitoring tool that delivers real-time performance monitoring, alerting, and advanced root cause analysis for SQL Server environments.
Best for: Medium to large companies with complex SQL environments requiring real-time visibility, scalability, and deep performance assessment and tuning capabilities across multiple SQL estates.
IDERA SQL sector coverage
Widely adopted in regulated sectors, such as financial services, healthcare and government, with strict uptime, audit, and reporting requirements and high-volume transaction environments
IDERA SQL standout features
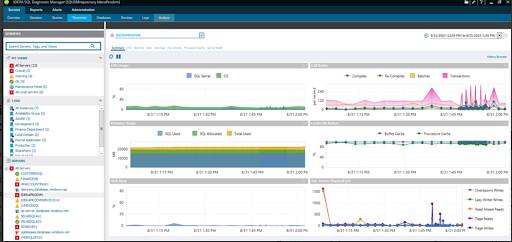
Integrated workload analysis and Query Tuner give you a single workflow to trace SQL Server performance issues from estate-level down to individual queries or users. You continuously monitor workloads down to one-second intervals, and capture execution plans, waits, resources, and query activity in real time.
Integrated Workload Dashboard: Spot spikes and bottlenecks such as slow queries, blocking, failed jobs, and CPU/memory pressures. When you highlight a problem period, the data tool reassesses that interval, drilling down from instance or database to specific statements and users.
Advanced Query Tuner: At the query level, you can pivot directly into Query Tuner for wait analysis, historical execution plans, operator costs, and tuning recommendations. You can identify regressions tied to code, schema, or environment changes, and see performance trends over days or weeks.
Deep Root Cause Analysis: For tuning, you get prescriptive fixes (indexing, query rewrites, and parameter adjustments). You can also model changes with “what-if” analysis and batch-optimize queries, and optionally script or automate fixes via PowerShell or APIs.
Dynamic alert response: With IDERA, you control how the system watches for and responds to problems. You get two approaches:
Set fixed thresholds for high-priority issues: For example, “if CPU is above 90%: kill sessions and run a script.” This gives you manual control over the moments you know you always need to intervene. These static thresholds let you hardwire responses for the most pressing emergencies and trigger automated actions every time those specific limits get crossed.
Dynamic baseline alerting: Here, IDERA monitors your servers, learns the usual patterns for every metric (CPU, memory, disk, queries), and establishes what’s normal for each instance based on real historical data. Over days or weeks, IDERA records your environment’s behavior, constantly recalculates what normal looks like, and sets adaptive baselines for every metric.
When something deviates way outside those learned norms, like when your CPU spikes in a way that’s truly abnormal for your workload, IDERA triggers an alert and actions just like a static threshold. For ordinary fluctuations, it remains quiet. Significant deviations break the baseline, trigger alerts, and run your automated playbook, reducing noise and false alarms.
Fully web-based and mobile administration: IDERA gives you a web dashboard and mobile app supporting real admin actions: view/kill processes, run queries, start/stop jobs, and adjust response thresholds remotely, even from mobile devices.
IDERA SQL reporting capabilities
You can export reports in PDF, CSV, or HTML format for:
Custom dashboards
Historical trend analysis
Enterprise rollups
Prescriptive recommendations
Alert history
Resource utilization
Compliance audits
Capacity planning
IDERA SQL security and compliance
Role-based access controls
Activity and change auditing
Data masking in non-production
Automated backup
Security configuration scanning
Historical logs for regulatory evidence and audit trails
IDERA SQL limitations
SQL Server only: Purpose-built for SQL Server.
Advanced configuration set-up time: Highly customizable functionality may take additional time to configure.
2. Quest Spotlight
Quest Spotlight is a SQL Server performance monitoring tool that provides 24/7 SQL Server Spotlight and diagnostics. It’s designed for real-time detection, health checks, and automated troubleshooting, with graphical dashboards and incident playback.
Best for: Medium-to-large teams focused on live root-cause analysis, rapid diagnostics, and proactive tuning across high-priority and high-volume SQL estates.
Quest Spotlight sector coverage
Used by finance, healthcare, retail, government, and managed service providers.
Quest Spotlight standout features
Incident playback: Spotlight lets you replay the timeline of your server and database activity around a performance issue. You can inspect detailed event chronologies, wait states, and bottleneck progressions minute-by-minute, making it easier to diagnose root causes and understand the full context leading up to an incident.
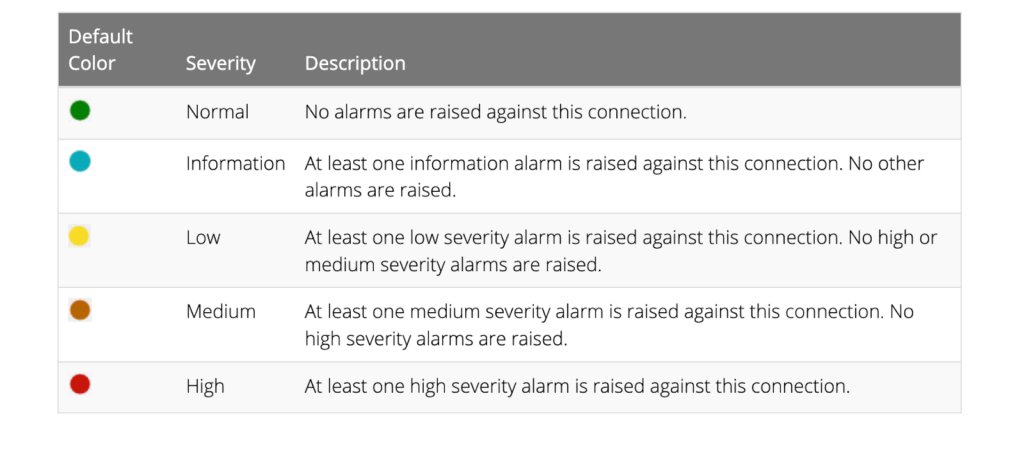
Heatmap dashboards: The tool offers high-resolution, animated health heatmaps to visualize real-time and historical performance data across your entire SQL estate. These dashboards provide instant clarity on system relationships and emerging trouble zones, enabling you to prioritize interventions based on actual server impact rather than isolated metrics.
Quest Spotlight reporting capabilities
You get interactive dashboards, PDF summaries, and exportable logs for:
Health check summaries
Live status dashboards
Incident logs
Customizable alert histories
Trending charts
Historical playback exports.
Quest Spotlight security and compliance
Role-based access
Audit logging
Alert and incident tracking
Customizable alarm actions
Secure data exports
Quest Spotlight limitations and pain points
Dashboard and usability: You may find root-cause drilldowns too complex.
Configuration complexity: Building federated views, custom alerts, and cross-server templates can be time-consuming in large environments.
Performance and scale: UI responsiveness may slow on estates with more than 100 active connections.
Licensing and access: Advanced features like incident playback, SCOM management pack, and multi-server federation are reserved for higher-tier licenses.
3. ApexSQL Monitor
ApexSQL Monitor is a SQL Server performance monitoring tool that offers agentless SQL Server monitoring for tracking and diagnosing performance issues, database health, and historical trends. You get real-time and historic analytics for queries, resources, and infrastructure, without installing anything on monitored SQL instances.
Best for: Small to mid-sized teams needing straightforward monitoring with low overhead.
ApexSQL Monitor sector coverage
Commonly used in IT consulting, education, MSPs, analytics, and SMBs.
ApexSQL Monitor standout features
Agentless monitoring engine: ApexSQL Monitor doesn’t require you to install any extra software or background processes on your SQL servers. Instead, it collects data by querying built-in SQL Server system views and metrics remotely, using protocols like WMI and standard SQL connections.
Agentless monitoring lets you centralize control, minimize configuration and risk, and get visibility across with near-zero performance impact, but sacrifices some of the depth of application-level tracing or fine-grained custom log collection.
Time slice drilldown (15-second granularity): ApexSQL Monitor lets you deep-dive into historical database performance using time slice drilldown down to 15 seconds, rather than simple minute/hour windows.
When you troubleshoot, you select the exact slice where a spike or anomaly hit, and ApexSQL immediately shows you slow queries, their wait types, which processes ran, and what resources were under stress at that moment. You can open a specific query to review its execution plan, fragmentation, and detailed metrics, making it easy to pinpoint downstream or related impacts in seconds.
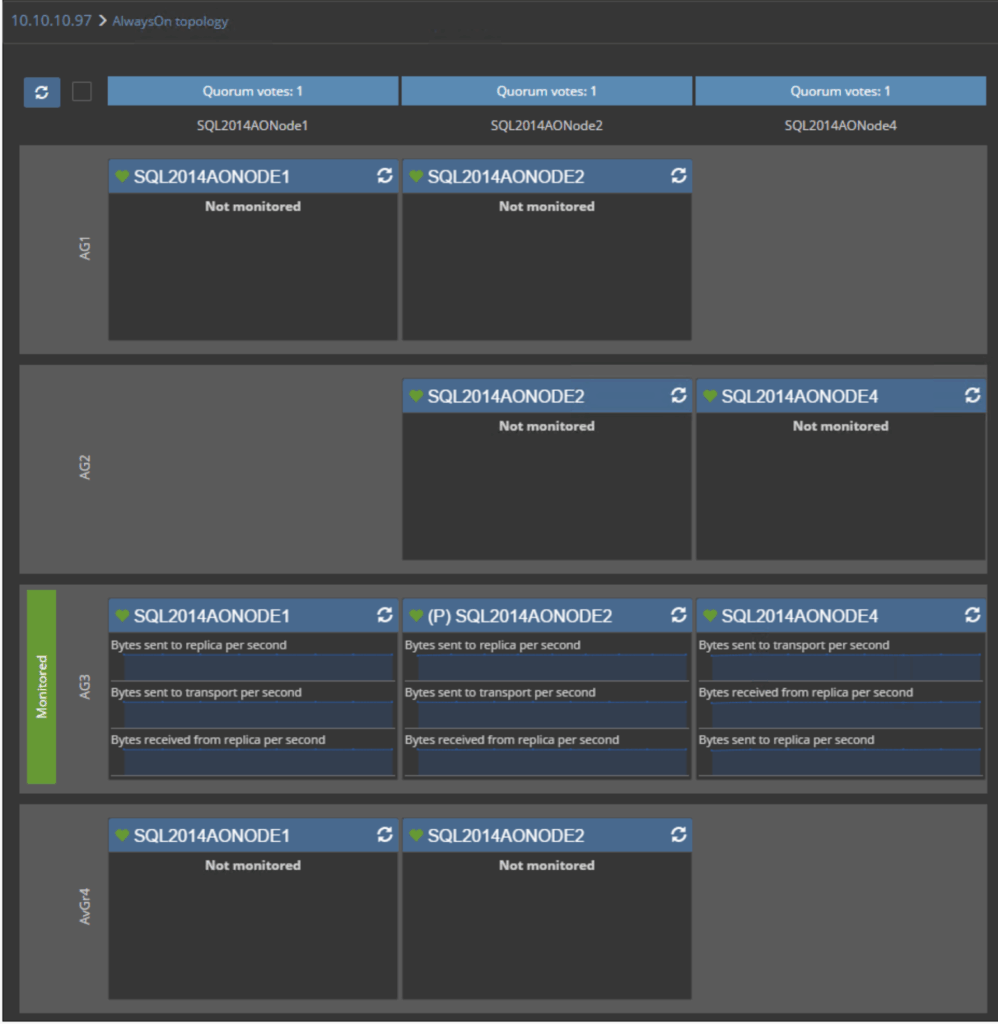
Graphical AlwaysOn topology visualization: ApexSQL’s AlwaysOn topology visualization provides a live, interactive map of your entire high-availability cluster environment: Windows Server Failover Cluster nodes, all replicas, and the data flow between them. You see each replica’s status (primary or secondary, healthy or degraded) and can monitor how databases, failover events, and client connections are distributed and change over time.
ApexSQL Monitor reporting capabilities
You can export PDF, HTML, CSV, and custom T-SQL reports for:
Real-time and historic performance dashboards
Customizable alert logs
Resource utilization summaries
Instance/server health snapshots
ApexSQL Monitor security and compliance
Role-based access
Audit logs
Alert tracking
Repository-level data retention and purging
Does not make changes to monitored SQL instances
ApexSQL Monitor limitations and pain points
Dashboard and usability: Alert noise can accumulate in high-volume environments, and you have to manually acknowledge and prioritize.
Setup and management: Agentless design means some real-time data may be delayed.
Licensing and access: Advanced analytics and AlwaysOn/HA monitoring require premium licensing.
4. Redgate Monitor
Redgate Monitor is a SQL Server performance monitoring tool known for its intuitive web interface and powerful automation features, Redgate Monitor helps teams identify and resolve performance issues before they impact users or business operations.
Best for: Enterprises and managed service providers (MSPs) seeking a unified, web-based monitoring platform with deep alerting customization, extensive integration options, and cross-server visibility.
Redgate Monitor sector coverage
Used in financial services, healthcare, and retail.
Redgate Monitor standout features
Comprehensive performance monitoring and optimization: Redgate Monitor provides continuous visibility into SQL Server performance across servers, databases, and queries, capturing key metrics such as CPU utilization, waits, I/O, and execution times to identify the precise causes of slowdowns or blocking.
The platform automatically establishes behavioral baselines for every instance, adjusting alert thresholds dynamically to reduce noise and highlight meaningful anomalies. From its unified dashboard, DBAs can drill from an estate-wide overview to a single query plan, review execution statistics, and isolate resource-heavy statements using its Top Queries analysis.
Tight integration with Redgate’s SQL Toolbelt — including SQL Prompt and SQL Compare — enables a direct workflow from diagnosis to query tuning or schema optimization, streamlining remediation efforts. Redgate Monitor’s hybrid architecture supports on-prem, Azure, and AWS environments, while its customizable alerting and automation options allow teams to define triggers by environment, application, or severity, integrating easily with PagerDuty, ServiceNow, or Slack. Its capacity forecasting engine leverages historical data to project CPU, memory, and disk trends, offering proactive guidance for scaling decisions.
While Redgate Monitor delivers strong usability and breadth for mid-sized SQL estates, larger enterprises may encounter alert fatigue and data retention limits without additional configuration or storage allocation.
Redgate Monitor reporting capabilities
You can export all reports in PDF, HTML, or CSV format for:
Performance trend analysis
Top query and workload reports
Resource utilization and capacity forecasting
Uptime and SLA reporting
Redgate Monitor security and compliance
Role-based access control (RBAC) for secure team collaboration
TLS encryption for data-in-transit protection
Centralized audit logs for change tracking and regulatory evidence
GDPR and HIPAA alignment for organizations handling regulated data
Redgate Monitor limitations and pain points
Configuration complexity: Initial setup and fine-tuning of alert thresholds across large estates can be time-intensive.
UI responsiveness: On environments with thousands of instances, dashboard load times can increase, especially when analyzing historical data in detail.
Windows focus: Although it supports cloud environments, Redgate Monitor is still optimized for SQL Server on Windows, with limited support for Linux-hosted instances.
5. SolarWinds SQL Sentry
SolarWinds SQL Sentry is a SQL Server performance monitoring tool designed to help database administrators proactively detect, diagnose, and resolve performance bottlenecks before they affect end users. Built with deep SQL Server awareness and automation, SQL Sentry delivers visibility into aspects of SQL Server health, helping teams maintain database performance across environments.
Best for: Teams needing detailed workload visibility, real-time alerting, and predictive performance tuning across large SQL Server estates.
SolarWinds SQL Sentry sector coverage
Suitable for finance, healthcare, manufacturing, education, and government
SolarWinds SQL Sentry standout features
Performance and query analysis: SQL Sentry delivers real-time visualization of SQL Server performance, combining live dashboards with historical playback to help DBAs identify blocking chains, deadlocks, and long-running queries across their environments.
Its Top SQL engine highlights the most resource-intensive queries, automatically collecting execution plans, waits, and I/O metrics to pinpoint inefficient code and missing indexes. Event Chain technology maps dependencies between SQL processes to reveal how locks and jobs interact, enabling faster root-cause diagnosis.
Intelligent alerting supports both static thresholds and adaptive baselines, with automated responses such as diagnostic capture or external notifications through integrations with ServiceNow, PagerDuty, and Slack. SQL Sentry also monitors AlwaysOn Availability Groups and Azure SQL environments, offering unified insight across hybrid estates.
Through its integration with SolarWinds Plan Explorer, users can dive deeper into execution plan costs and tuning recommendations, though context switching between modules may slow analysis in larger deployments. Overall, SQL Sentry provides a capable and comprehensive monitoring suite for SQL Server teams, though its configuration complexity and reliance on separate interfaces can increase setup and learning time compared to more consolidated platforms.
SolarWinds SQL Sentry reporting capabilities
SQL Sentry provides exportable and schedulable reports in PDF, HTML, and CSV formats, covering:
Performance trend analysis and heatmaps
Blocking, deadlock, and event chain visualizations
Resource utilization by instance and database
SolarWinds SQL Sentry security and compliance
Role-based access control (RBAC) with granular user permissions
Audit trails for user actions and configuration changes
Integration with Active Directory for authentication and access management
Supports compliance with HIPAA, GDPR, SOX, and other major frameworks
SolarWinds SQL Sentry limitations and pain points
Configuration complexity: Initial deployment and setup across large estates can be time-consuming and require tuning of alert thresholds to reduce noise.
Licensing model: Per-instance pricing can scale up quickly for large organizations, particularly when monitoring multiple environments.
Performance overhead: While lightweight, some users report increased server resource usage during high-frequency data collection.
Find a SQL Server Performance Monitoring Solution That Supports Your Data and Business Efforts
While there are many SQL Server performance monitoring tools available, we’ve highlighted five that stand out in a market where it’s essential to move beyond generic, one-size-fits-all promises. You have the opportunity to architect a monitoring stack that’s dynamic, secure, and perfectly tuned to your never-static SQL needs.
IDERA takes care of diagnosis, backup, protection, inventory, and audit so you can focus on shaping a hygienic, reliable, and secure data culture where data generates actionable analysis and directly moves your business towards your goals.
Accelerate your data performance and compliance goals with a performance monitoring tool built for your business needs. Contact the IDERA team to get personalized advice or request a demo to start optimizing your operations.
FAQ
What is the best SQL Server performance monitoring tool for large-scale SQL environments?
IDERA SQL Diagnostic Manager is a top-tier SQL Server performance monitoring solution for enterprises needing real-time monitoring, workload analytics, and customizable alert responses across large, complex SQL Server deployments.
Which SQL Server performance monitoring providers offer compliance-ready reporting?
IDERA, ApexSQL Monitor, and Quest Spotlight all offer robust reporting features that support audit trails, regulatory compliance, and long-term trend analysis for SQL Server environments.
What’s a good SQL Server performance monitoring tool for MSPs or multi-tenant setups?
PRTG SQL v2 Sensor and Quest Spotlight are well-suited to managed service providers. Both support large-scale monitoring and centralized alerting across multiple clients or server environments.
Is there a SQL Server performance monitoring tool that uses AI or natural language input?
Yes. BlazeSQL offers a unique AI-driven interface that enables users to ask questions in plain English and receive live, SQL-based insights, making it a user-friendly SQL Server performance monitoring solution.
Which SQL Server performance monitoring tools are budget-friendly for small teams?
For smaller teams or IT consultants, ApexSQL Monitor and BlazeSQL offer a lightweight setup, low overhead, and essential monitoring features without enterprise-level pricing or resource requirements.
Can I use these SQL Server performance monitoring tools in the US, UK, or Europe?
Yes. The tools featured in this guide provide support, licensing, and deployment options across the United States, the United Kingdom, and European markets, including cloud and on-premise flexibility.
Brandon Adams
SQL Server Tools Product Marketing Manager
With over two decades of experience in SQL, SaaS, data center infrastructure, power quality, data storage, disaster recovery, and IT security, Brandon bridges technical expertise with business needs to help organizations get the most out of their data environments. He focuses on making complex database and infrastructure challenges easier to understand, enabling DBAs and IT leaders to improve performance, strengthen security, and simplify management.
Keep SQL Server Fast, Reliable and Secure - with SQL Diagnostic Manager