SQL Doctor
SQL Doctor
SQL Doctor Product Tour
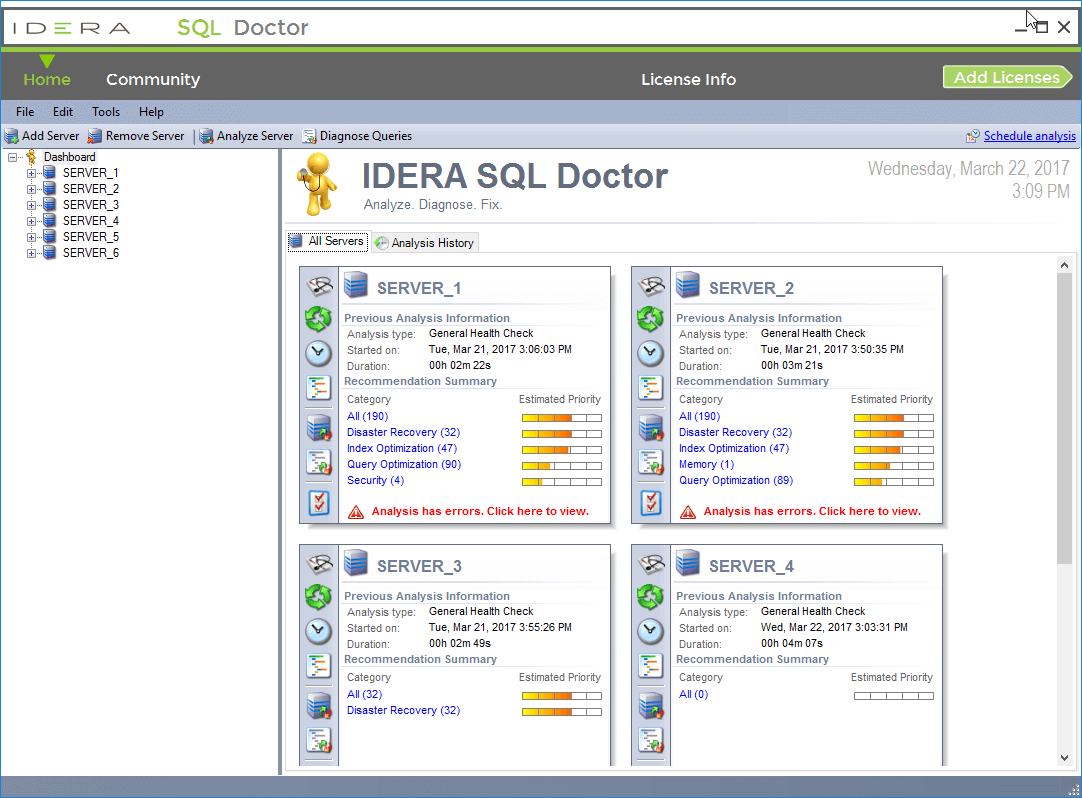
All Servers View : Quickly see the overall health of all registered servers, based on the last analysis run. From this tab, access quick links to the shared tasks for a server such as updating SQL Doctor settings, reviewing wait stats, and analyzing a query. Collect SQL Server performance information, analyze it, and determine the resolution in minutes rather than hours.
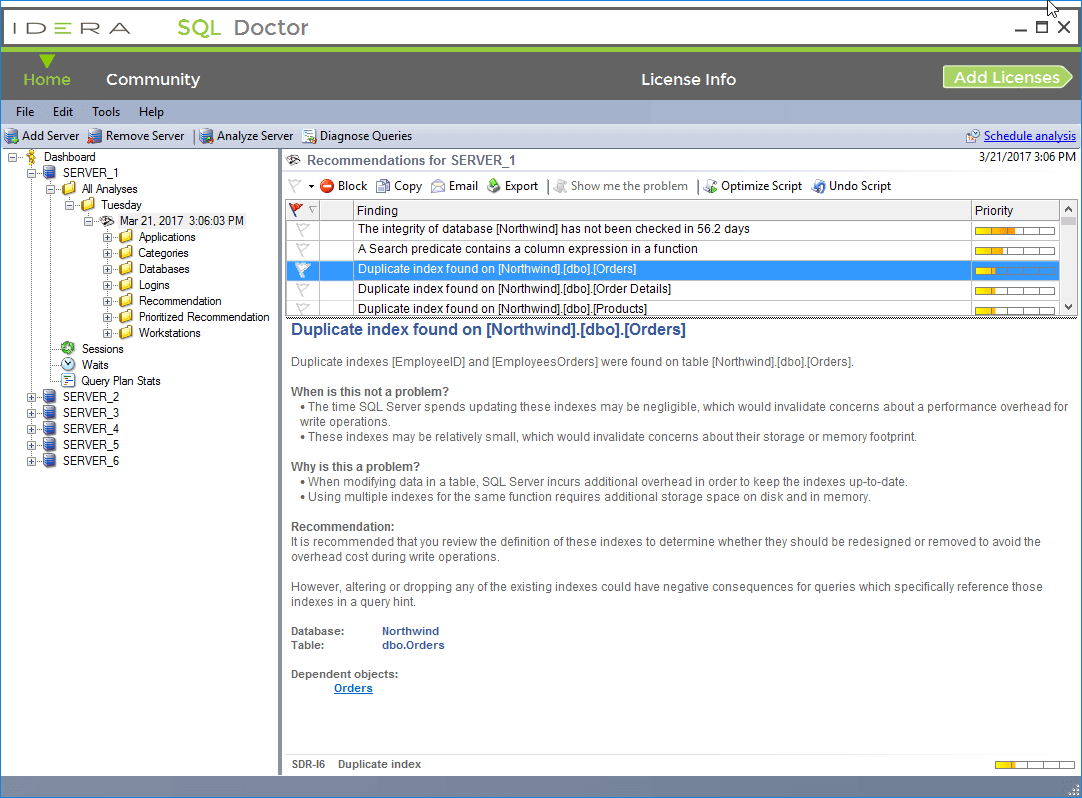
Recommendations View : View a list of performance recommendations based on a full analysis based on selected criteria. The performance gain you receive from making the suggested change, how relevant it is for the parameters you specified when configuring the analysis, and the confidence SQL Doctor has in the recommendation determines the priority of the recommendation. Narrow the recommendations by targeted applications, selected performance categories, databases on the server, and more.
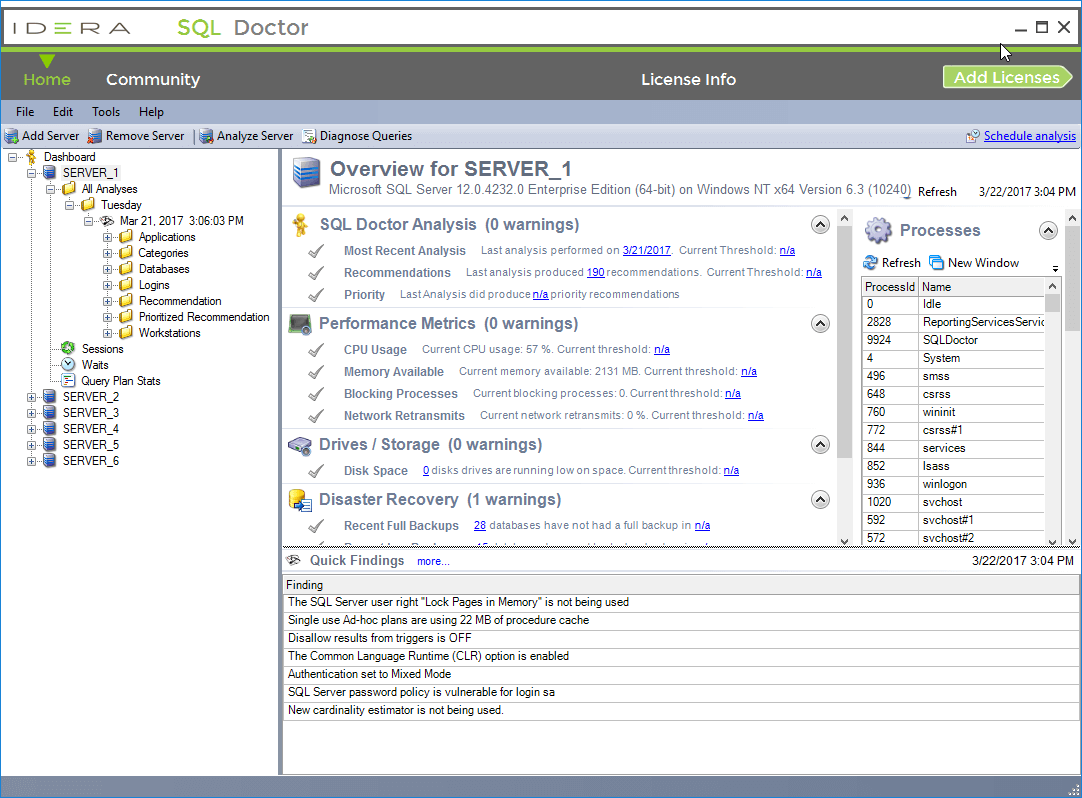
Server Overview View : Quickly see the overall health of each registered server, as of the last refresh. See a server health checklist that highlights where performance issues may be happening in real time. Review real-time, key performance metrics for each major area of the server. Display quick findings based on the values of the key metrics to start troubleshooting performance problems immediately.
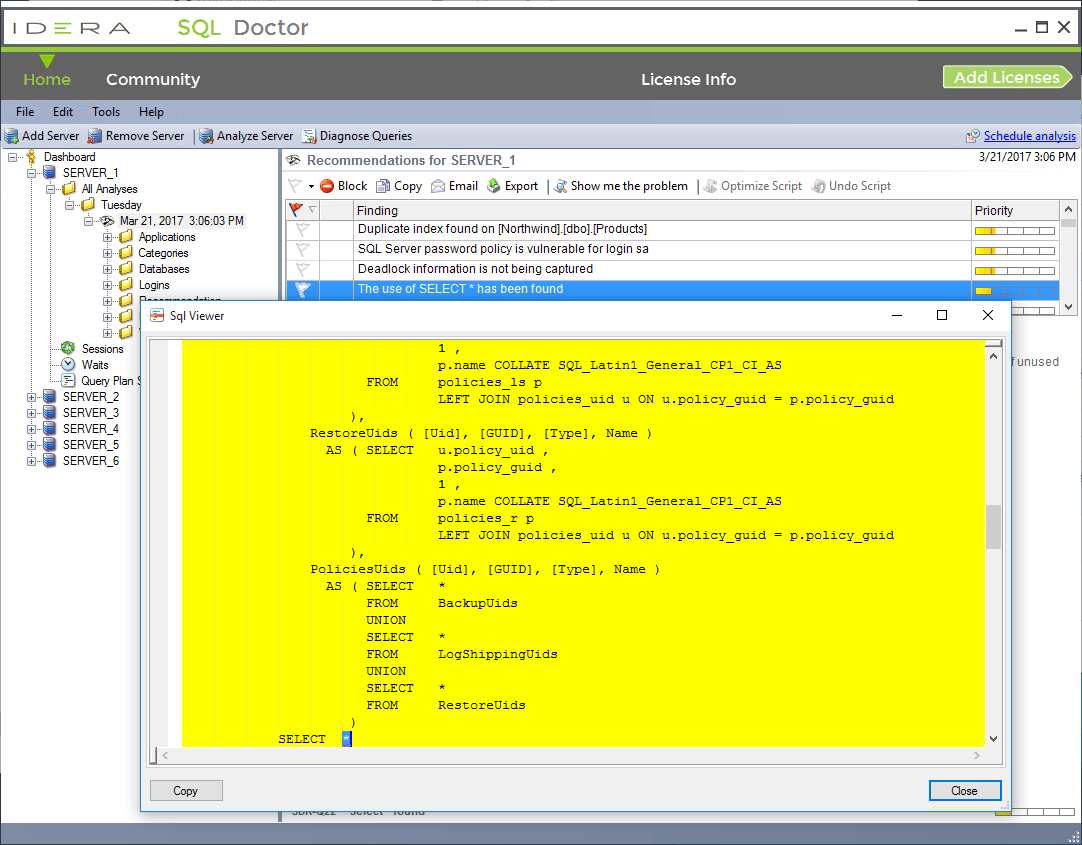
SQL Viewer Window : View the SQL text for a selected recommendation. Copy the SQL text to the clipboard to see it in a text editor or SQL Server Management Studio.
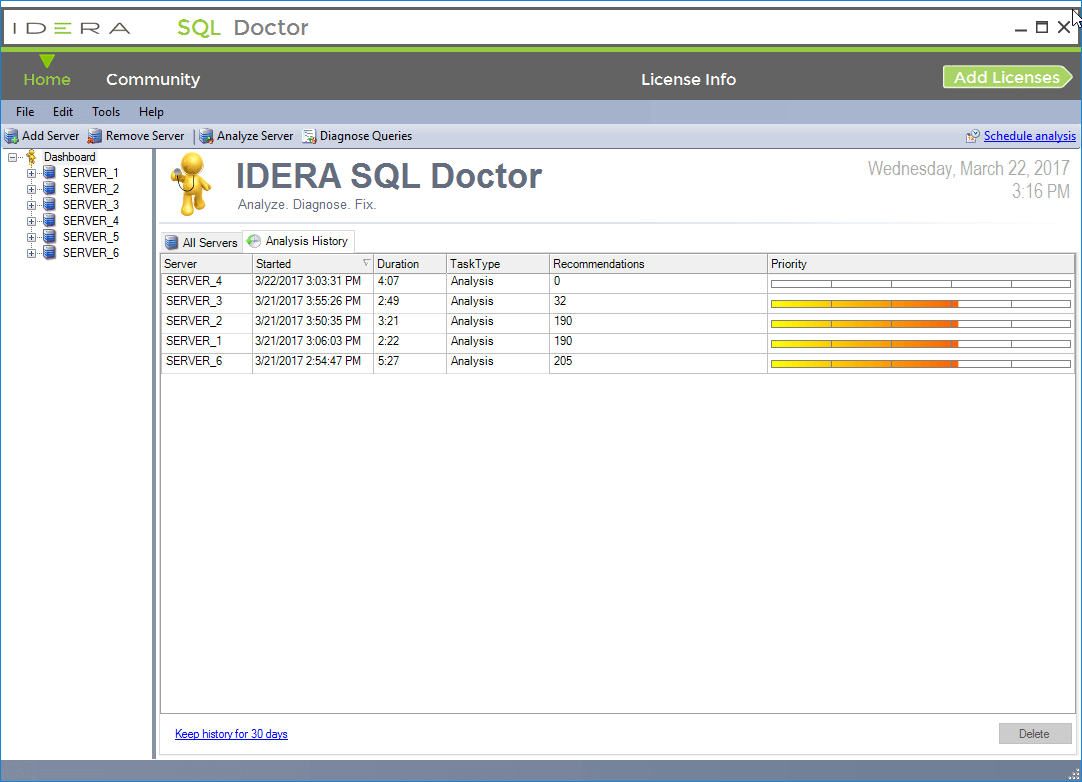
Analysis History View : Access the results of every analysis stored by SQL Doctor for your registered SQL Server instances. Summaries include the name of the analyzed server, start time, total time duration, type of analysis performed, total number of recommendations, and highest priority recommendation. For each historical analysis, view recommendations, and delete and schedule an analysis.