Video : SQL Diagnostic Manager for MySQL
Overview
SQL Diagnostic Manager for MySQL is a powerful MySQL monitoring and management tool that helps database administrators and developers optimize the performance and security of their MySQL servers. There are several reasons you should use this tool:
- Real-time monitoring: It provides real-time monitoring of your MySQL servers, allowing you to identify performance bottlenecks, slow queries, and other issues.
- Customizable dashboards: It offers customizable dashboards that allow you to view key performance metrics and server statuses at a glance.
- Alerts and notifications: You can configure it to send alerts and notifications based on specific conditions, helping you address potential issues before they become critical.
- Performance tuning: It includes a variety of tools for performance tuning, such as query analyzers, index suggestions, and server configuration recommendations.
- Security auditing: It helps you maintain how secure your MySQL servers are by providing tools for user management, privilege analysis, and auditing of server activity.
- Ease of use: It has an intuitive web-based interface that makes it easy to monitor and manage your MySQL servers, even for users with limited database administration experience.
- Compatibility: It is compatible with various MySQL distributions, such as Oracle MySQL, Percona Server, and MariaDB.
- Scalability: It can monitor multiple MySQL servers, making it suitable for large-scale deployments.
Watch this video to see an overview of SQL Diagnostic Manager for MySQL.
Transcript
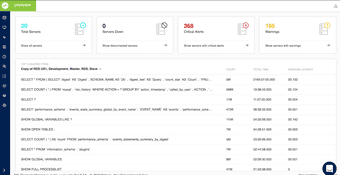
Hello everyone. Today I will be presenting a quick walkthrough of SQL Diagnostic Manager for MySQL and MariaDB. Now before we start let me give you a quick introduction about the tool. SQL Diagnostic Manager for MySQL and MariaDB is an agentless, on-premises MySQL and MariaDB monitoring solution that gets up and running within two minutes. Now it is a class ready solution and works well with all the flavors of standard and hosted MySQL. With SQL Diagnostic Manager you can monitor your critical databases confidently rather than hunting and pecking for speed with other monitoring solutions. Now the moment you launch SQL Diagnostic Manager it takes you to the overview page which gives you a full capture performance visibility across the databases. You get to see the total number of servers you have registered with the tool. In case any of these servers are down. What are the critical alerts and warnings associated with each of these servers? And not only that. You also get to see the top 10 running queries based on total execution time. And with just a single click of a button, you get to see the relevant query details as well. So, all in all, it basically allows you to avoid the visibility gap and helps you or enables you to achieve faster issue resolution time. Next up we have the service page. Now the service page allows you to view all the servers that you have registered with the tool. One interesting feature that can be accessed by the service page is the disinformation feature. Now suppose if you are trying to do a disk cleanup exercise and you are trying you are in the process of figuring out the top candidates for cleanup. So in such cases, you can use the disconfirmation feature all you need to do is select a particular server. Go to disk information feature. And the tool allows you to drill down to the database level. Here you can uncover which database is taking most of the great space. What is my data size? What is the total size of a particular database? If there is too much of indexing or not and not. And not only that. If you would like to drill down even further to the tool allows you to do that. With just a single click of a button, SQL Diagnostic Manager takes you to up to the table level which helps you uncover the information required for you to figure out the top candidates for cleaner. When it comes to a disk cleanup exercise which results in spraying of the subspace. Moving forward we have the dashboard feature. Now, this is one of the most loved features of SQL Diagnostic Manager as it has all the charts that indicate the health of your MySQL environment. Any spike in these charts could be a good indicator of bad performance. You can look into this spike and see the corresponding queries. Now, this helps immensely when you are trying to look for the […] query causing the issue. Now, this does not end here. Now what I am excited to show you guys here is the capability for our users to roll out their own custom dashboards. All you need to do is click on Create a New Dashboard. You just have to enable the parameters that you would like to see in your particular chart. And you have to click on Save. Once you do that you will be able to roll out to your own dashboard and charts which you think suits your MySQL environment. Now the reason we allow our users or we provide this flexibility to our users is because we believe one size does not fit all. And a lot of users they would like to do a lot of cutting and trending for a lot of matrices. Next up we have the monitors page. Now SQL Diagnostic Manager gets shipped with more than six hundred plus best practices monitors and advisors. Now the moment you install SQL Diagnostic Manager and point it towards your server it starts monitoring your MySQL and MariaDB servers. And provides you timely alerts and advices before things go wrong. Now, these monitors are not just simple plugins. We have business partners with MariaDB who deploy our tool on the field. And while doing so they keep sending feedback based on their experience. This eventually helps us constantly update and add new advisors to the tool. The best part about these monitors is that the underlying code is not hidden from our users. All you need to do is click on a particular monitor. And you get to see the underlying logic or the function running that particular monitor. And now if you are someone who would like to customize these monitors we give our users the flexibility to do that as well. All you need to do is change the underlying function. Set the critical threshold and warning thresholds. And you can customize these monitors to your heart’s content. Okay so moving forward moving. We have the rails a mounting feature. Now real-time monitoring is what you need when you want to see what is happening in your servers in real-time. I will just show. I will just load a safe session for you to demonstrate the matrix that it collects. You so this is how the information layout looks like now. Real-time continuously execute a bunch of queries on your servers and fetches information such as. And as you can see here what are the top running queries for this particular time frame in this particular time frame. What are the most busiest database tables, and databases? What I must look very logs. What are my locking queries and log tables? And things like that. So since all this information is retrieved in real-time you get to see what if servers are up to at any point of time. This particular session can also be stopped and saved for later analysis. Now the real-time margin feature is very beneficial because sometimes you need to have high fidelity monitoring in place to do when. Especially when you are getting into a specific debugging session. Moving forward we have the query analyzer feature. Now it is one of the most powerful features of SQL Diagnostic Manager as it lets you capture queries using multiple endpoints. You can either capture query using this. You can either analyze the slow query log, the journal query log, or the sniffer. This is how the information layer looks like. You get to see the top five running queries based on total execution time. Now if you are someone who is trying to do a non-obtrusive query analysis. Now we have something we unique which we call this paper feature. Now, this is pretty unique to Monyog. Pretty unique to SQL Diagnostic Manager. What it basically does is it takes a dump of show full process list every single second. And store it in our repository. And then you can later run the run reports on that. Clean up literals and even group queries. Because this query analysis feature easily uncovers the problematic queries. It allows you to focus your time on the queries that yield the highest value rather than shooting in the dark and waiting for the database performance to go horribly low. Moving forward we have the audit log feature. Now in recent years, there has been a mock need for more sophisticated tools. Due to the increased internal and external security on security and auditing policies. Now both MariaDB and MySQL implement auditing by native plugins. These are fully configurable and made database activities in a variety of formats. The resulting log may be read directly or analyzed by a tool such as ours the SQL Diagnostic Manager. And once you analyze the audit log it provides you a summary of pay logins, the […] events, and the schema changes. There are changes and stored procedures. And apart from that it also allows you to view fields such as the user name, host operations, database table, and queries. All within in within an easy-to-read tabular format. Now, this is pretty useful for companies who have a big team in place. And they would like to audit the activities that are happening in their MySQL environment. Okay so moving forward. We have the track configuration change feature. Now SQL Diagnostic Manager gives you an option to track and compare server configuration. Now, this is pretty unique to the tool again. And no other modeling solution in the market currently provides this capability. Now I will give an example. If you have a set of servers that are of different versions. And some servers have performance problems because could be the difference in the configuration of these servers. Now using SQL Diagnostic Manager you get you can see a side-by-side difference in the configuration of servers with just a single click. All you need to do is click on Show Only Change Values. And once you do that you can see a side you can see a side-by-side comparison between the configuration changes of all the servers that you have registered with the tool. And not only that. You can even track these changes. So all you need to do is toggle from compared to track. And here in you can see at what time the latest configuration change was made. And when was the configuration changed for the very first time? All right moving forward. We have the replication of over page. Now, this application page basically allows you to view the replication hierarchy of your servers along with details of each replicated server to make sure that the data is up and running at all times. Now at any point in time, you can switch from graphical to table your application view to get a deep dive into the running servers. And it basically helps you uncover information whether or not these sleeves have stopped or if there is any lag between the master and slave servers. Now, this is just a simple master-slave setup. Apart from that SQL Diagnostic Manager also supports multi-master and multi-source application. So this brings us to the end of this session. Now last but not the least if you need a complete MySQL monitoring system with early warning mechanisms and you are tired of using expensive unreliable monitoring tools. Do download a free trial of SQL Diagnostic Manager for MySQL and MariaDB. We promise that you will never look back. Thank you for having me. And have a good one.
See Also:
- Webcast: What’s New in SQL Diagnostic Manager for MySQL 8.9
- Datasheet: Monitor MySQL Performance with SQL Diagnostic Manager for MySQL
- Datasheet: Monitor SQL Server Performance with SQL Diagnostic Manager for SQL Server
- Datasheet: SQL Diagnostic Manager for MySQL
- Video: Why Use SQL Diagnostic Manager for MySQL
- Video: Achieve Faster Issue Resolution Time for MySQL and MariaDB with SQL Diagnostic Manager
- Video: Audit Log Analysis for MySQL and MariaDB Databases with SQL Diagnostic Manager
- Video: Become Better at Monitoring MySQL and MariaDB Databases with SQL Diagnostic Manager
- Video: High Availability and Scalability with Galera Cluster for MySQL
- Video: Introduction to SQL Diagnostic Manager for MySQL
- Video: Monitoring Amazon RDS for MySQL and MariaDB with SQL Diagnostic Manager: Beyond Raw Logs
- Video: MySQL Performance Tuning with SQL Diagnostic Manager
- Video: MySQL Performance Tuning with SQL Diagnostic Manager – Part 1 of 4
- Video: MySQL Performance Tuning with SQL Diagnostic Manager – Part 2 of 4
- Video: MySQL Performance Tuning with SQL Diagnostic Manager – Part 3 of 4
- Video: MySQL Performance Tuning with SQL Diagnostic Manager – Part 4 of 4
- Video: Real-time MySQL Monitoring and RDS File-based Log Monitoring with SQL Diagnostic Manager
Topics : Database Diagnostics,Database Monitoring,Database Performance,SQL Query Performance,
Products : SQL Diagnostic Manager for MySQL,