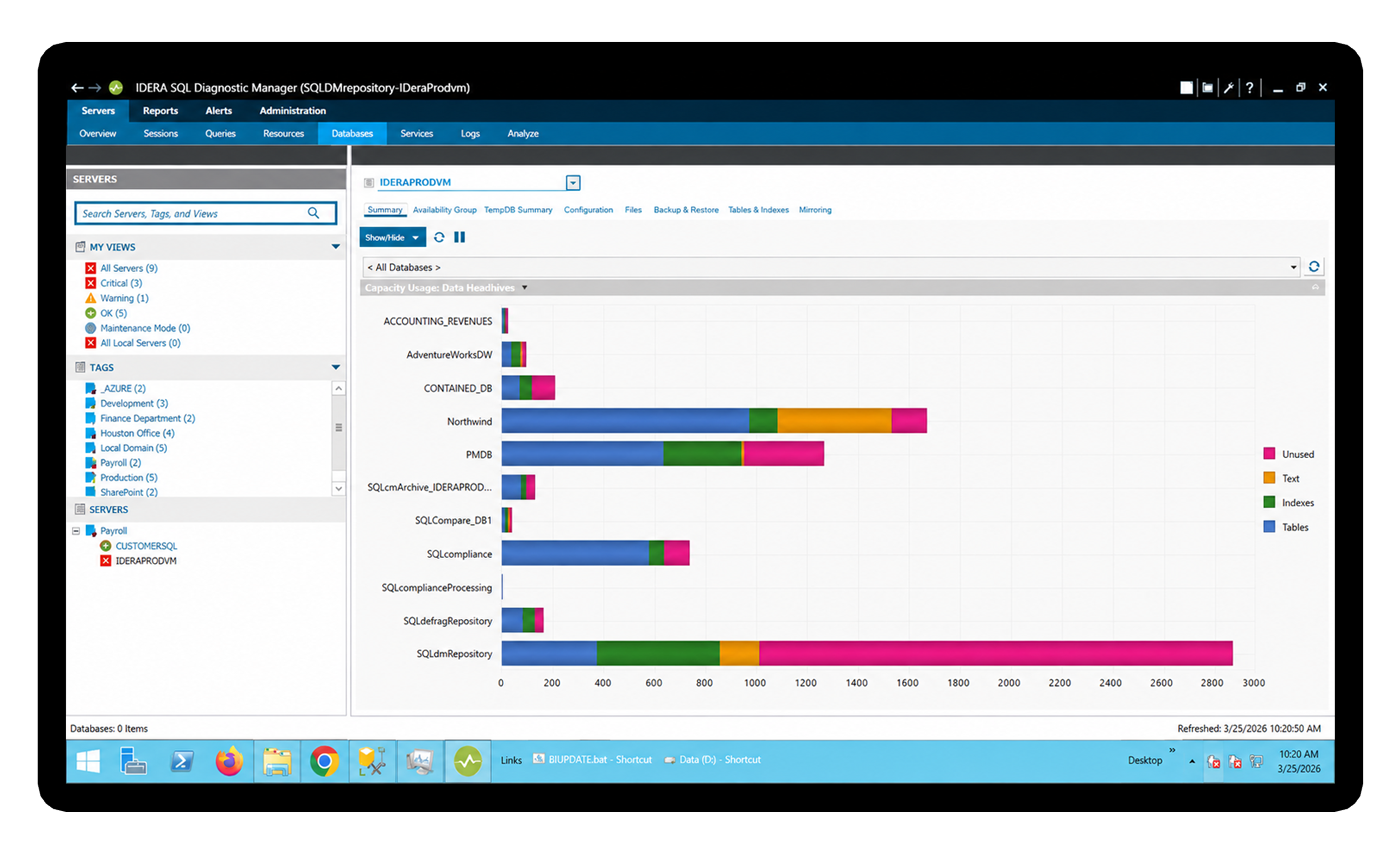
SQL Server Database Monitoring

The All-in-One SQL Server Performance Monitoring Platform for Modern DBAs, Now with AI-Driven Insights

Continuously monitor, diagnose, and tune SQL Server performance across on-prem, hybrid, and cloud environments with deep root-cause analytics, AI-driven insights, agentless architecture, and intelligent recommendations.

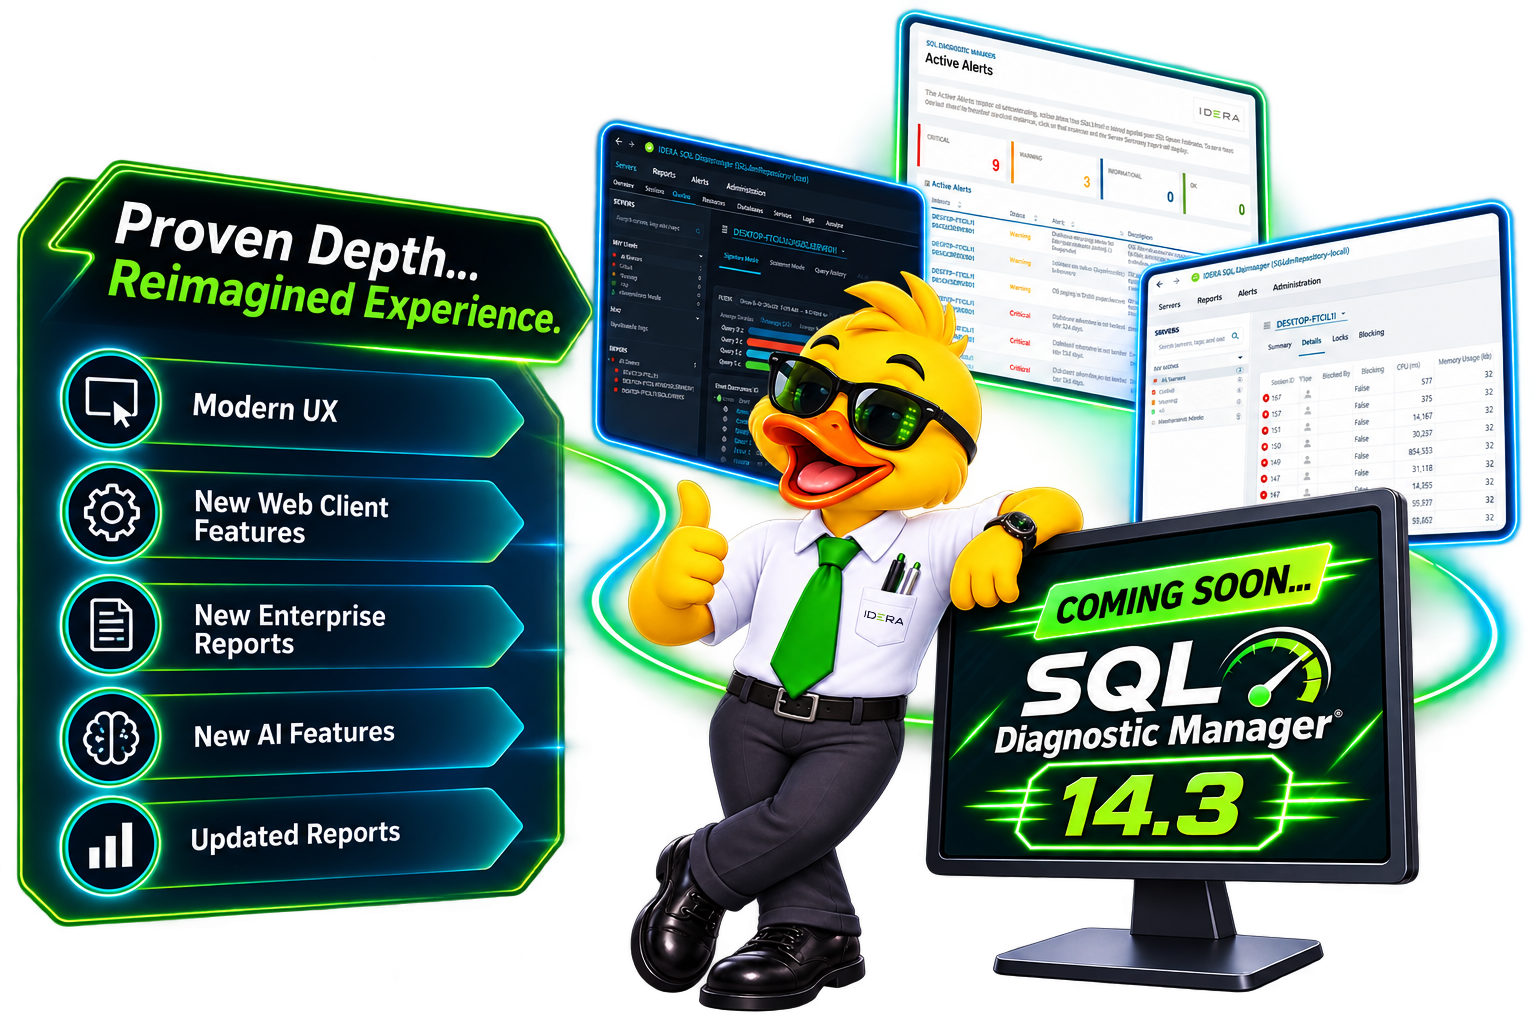
sql-diagnostic-manager-with-AI-1.png
Monitoring Reporting_SQL-DM

Why SQL Diagnostic Manager?

Your essential tool for SQL Server performance monitoring, now with AI-powered insights

Database performance affects the responsiveness of business-critical applications. Organizations that rely on databases can outperform the competition by ensuring that their databases are fast and reliable.

This tool enables database administrators to save considerable time, as it allows even those with limited experience to rapidly identify and resolve underlying issues. AI-powered analysis and intelligent recommendations help cut down troubleshooting from days or weeks to just seconds.

With SQL Diagnostic Manager, incidents can be quickly identified, fixed, and prevented, improving the overall efficiency of database administration

Features & Benefits

Unified SQL Performance Monitoring

Comprehensive monitoring solution with enterprise-grade features

Unified SQL Performance Monitoring

Unified SQL Performance Monitoring

See Every Layer. Solve the Problem Faster.

SQL Diagnostic Manager delivers complete SQL Server performance monitoring – across on-prem, hybrid, and cloud – so DBAs can find the true cause of slowdowns in seconds.

  • List IconQuery-level observability plan history, Query Store integration, execution comparison
  • List IconDeep SQL root-cause insight waits, blocking chains, deadlocks, TempDB pressure, I/O latency, and fragmentation
  • List IconCross-tier visibility from SQL to OS, virtualization, storage, and cloud resources
  • List IconAgentless Architecture allows minimal overhead with full data collection
  • List IconAI Powered dB Performance Optimization – NEW
  • List IconAI vs Original Query Comparison Ability – NEW

Learn more about AI Capabilities

Unified SQL Performance Monitoring

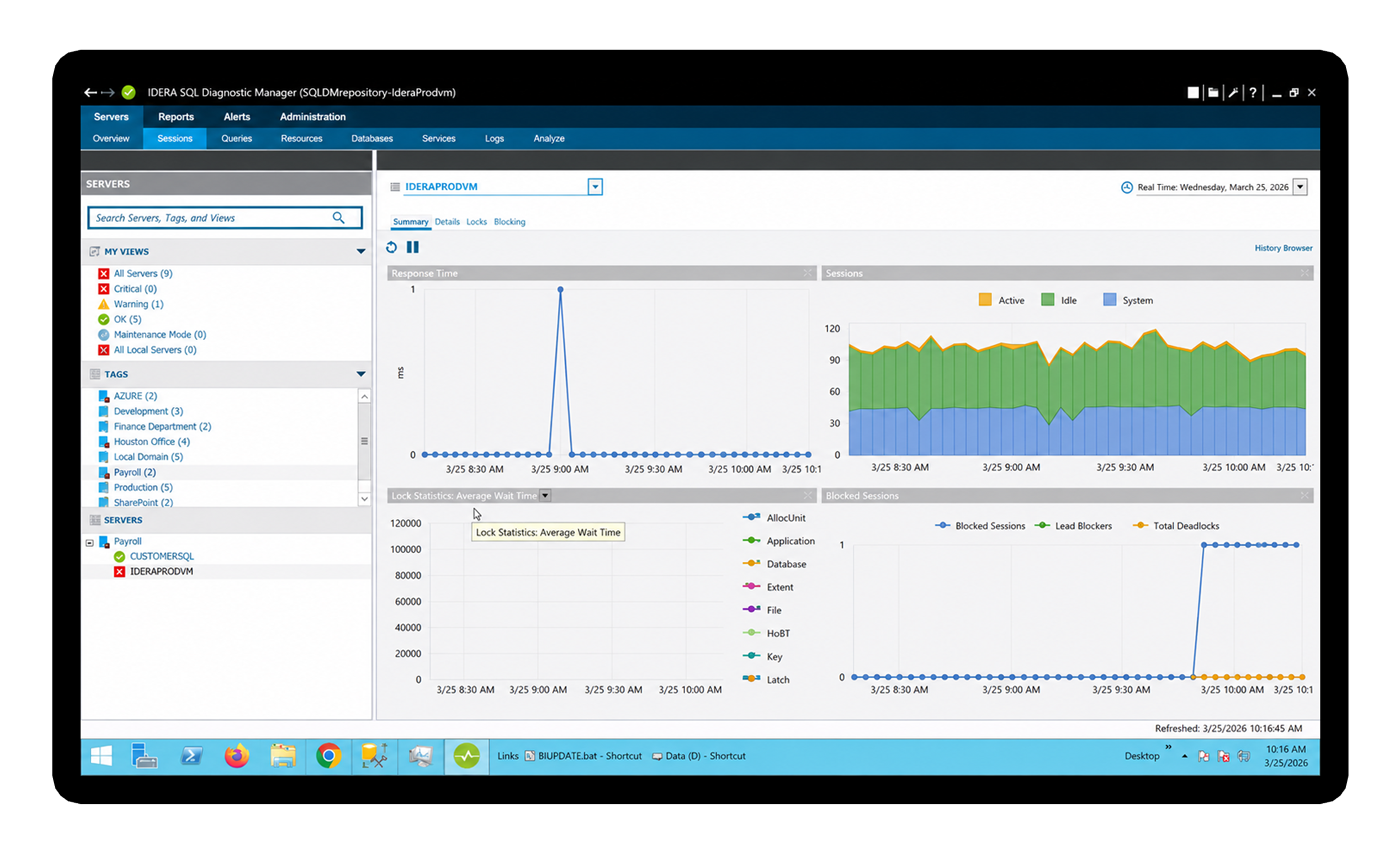
SQL Diagnostic Manager hardware resources allocation and usage console view.

SQL Diagnostics & Prescriptive Analytics

 Enterprise Snapshot view, Dark Theme

SQL Diagnostics & Prescriptive Analytics
SQL Diagnostics & Prescriptive Analytics icon

Smarter Insights. Actionable Recommendations.

SQL Diagnostic Manager transforms raw performance data into prescriptive analytics and intelligent recommendations, helping DBAs tune SQL Server efficiently and consistently.

  • List IconPrescriptive tuning guidance for CPU, memory, I/O, TempDB, and query performance
  • List IconFragmentation analysis with automatic recommendations
  • List IconCost Observability with cloud tagging + optimization insights to control spend
  • List IconReplication monitoring and health scoring
Enterprise Grade Coverage & Forensics
Enterprise Grade Coverage and Forensics

Monitor, Analyze, and Retain Everything - On Your Terms.

SQL Diagnostic Manager offers data ownership, long-term retention, and comprehensive reporting for complete operational clarity and compliance-ready visibility.

  • List IconCustomer-owned repository for multi-year SQL forensic analysis

  • List IconNo ingest fees— predictable, per-instance pricing
  • List IconComprehensive reporting suite out-of-the-box + fully customizable reports
  • List IconWeb and thick client options for flexible enterprise workflows
  • List IconScales across large SQL Server estates without performance impact
Enterprise Grade Coverage & Forensics

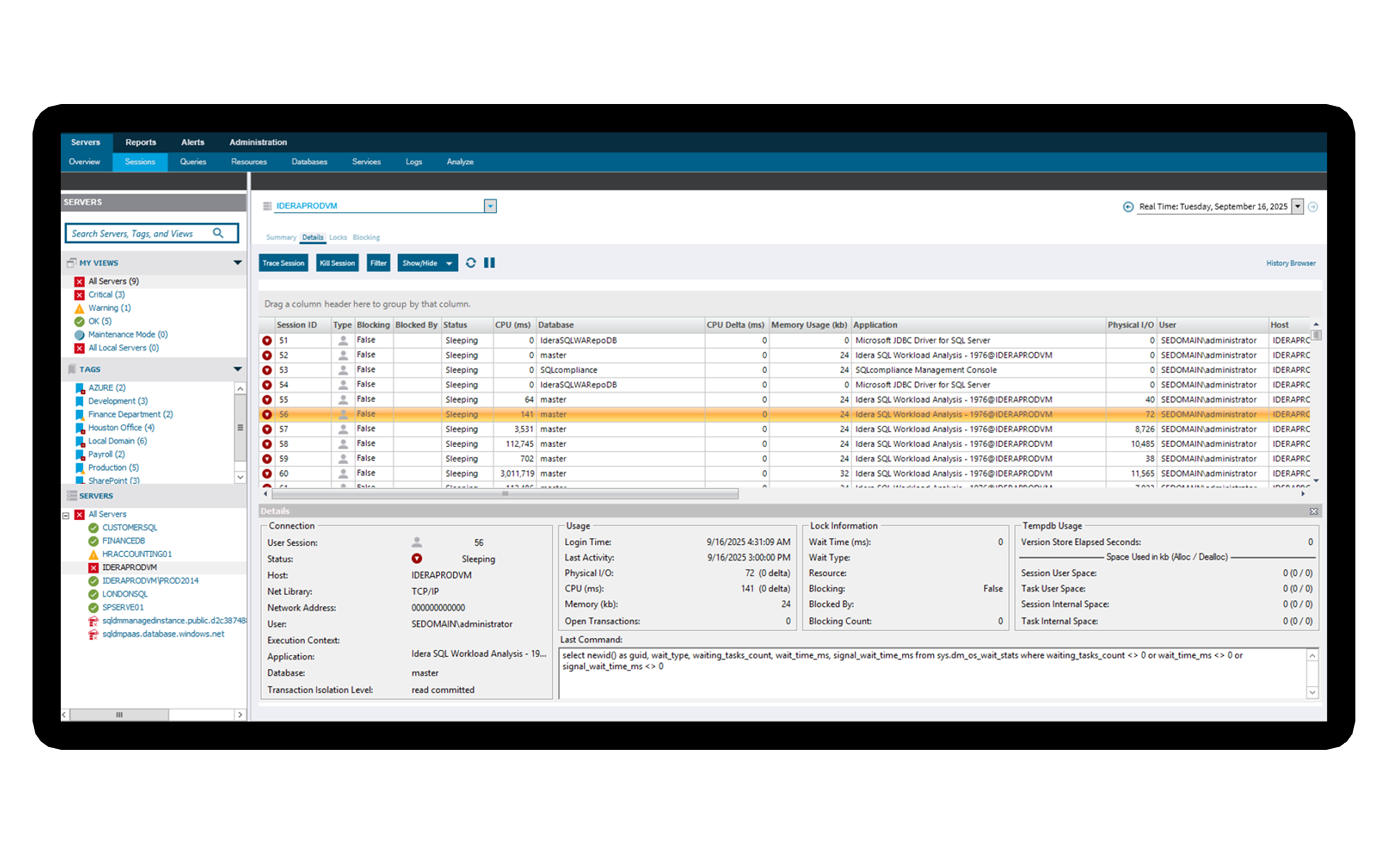
SQL Diagnostic Manager Session’s activity console view

Enterprise Grade Coverage & Forensics

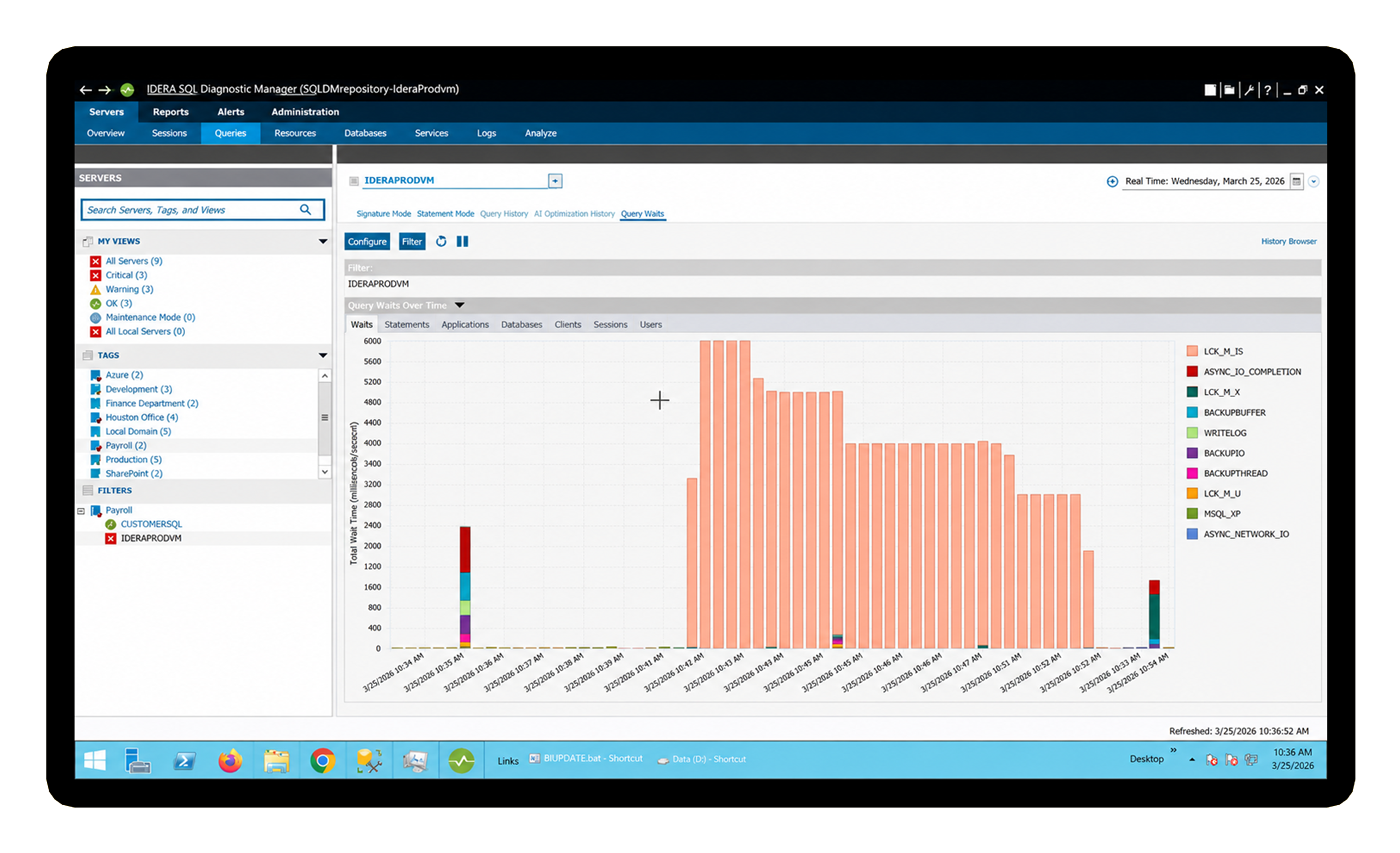
SQL Diagnostic Manager Query monitoring and analysis

Cloud & Hybrid SQL Performance Management
SQL Diagnostics & Prescriptive Analytics icon

Consistent SQL Server Monitoring Everywhere You Run SQL

SQL Diagnostic Manager brings full enterprise SQL server performance management to on-prem, cloud and hybrid environments without losing visibility or control – from Azure SQL DB, Azure MI, AWS RDS and GCP.

  • List IconUnified dashboards that normalize metrics across environments
  • List IconCost monitoring with cloud tagging for budget alignment
  • List IconWorks across VMs and Hyper-V—including guest OS performance
  • List IconAgentless, secure deployment ideal for hybrid architectures

    Platform Capabilities

    Comprehensive Database Monitoring Platform

    Everything you need to monitor, secure, and optimize your SQL Server infrastructure

    Deep SQL Root-Cause Analysis

    Agentless, Low-Overhead Architecture

    Hybrid & Cloud Ready Coverage

    Owned Data & Long-Term Forensics

    Intelligent Analytics & Recommendations

    Turn monitoring into actionable performance tuning

    Turn monitoring into actionable performance tuning

    • List IconAI-assisted insights (planned SQL-aware guidance)
    • List IconBaselines with intelligent thresholding
    • List IconBaselines with intelligent thresholding
    • List IconFragmentation analysis with fix recommendations
    • List IconReplication monitoring & health scoring

    Outcome: Smarter tuning, reduced noise, and faster mean-time-to-diagnosis.

    Agentless, Low-Overhead Architecture

    Turn monitoring into actionable performance tuning

    • List IconAI-assisted insights (planned SQL-aware guidance)
    • List IconBaselines with intelligent thresholding
    • List IconBaselines with intelligent thresholding
    • List IconFragmentation analysis with fix recommendations
    • List IconReplication monitoring & health scoring

    Outcome: Smarter tuning, reduced noise, and faster mean-time-to-diagnosis.

    Hybrid & Cloud Ready Coverage

    Turn monitoring into actionable performance tuning

    • List IconAI-assisted insights (planned SQL-aware guidance)
    • List IconBaselines with intelligent thresholding
    • List IconBaselines with intelligent thresholding
    • List IconFragmentation analysis with fix recommendations
    • List IconReplication monitoring & health scoring

    Outcome: Smarter tuning, reduced noise, and faster mean-time-to-diagnosis.

    Owned Data & Long-Term Forensics

    Turn monitoring into actionable performance tuning

    • List IconAI-assisted insights (planned SQL-aware guidance)
    • List IconBaselines with intelligent thresholding
    • List IconBaselines with intelligent thresholding
    • List IconFragmentation analysis with fix recommendations
    • List IconReplication monitoring & health scoring

    Outcome: Smarter tuning, reduced noise, and faster mean-time-to-diagnosis.

    Intelligent Analytics & Recommendations icon

    Turn monitoring into actionable performance tuning

    • List IconAI-assisted insights (planned SQL-aware guidance)
    • List IconBaselines with intelligent thresholding
    • List IconBaselines with intelligent thresholding
    • List IconFragmentation analysis with fix recommendations
    • List IconReplication monitoring & health scoring

    Outcome: Smarter tuning, reduced noise, and faster mean-time-to-diagnosis.

    Testimonials

    Loved by Database Professionals

    Join thousands of DBAs who trust SQL Diagnostic Manager

    SQL Diagnostic Manager provides in minutes information that would take the whole database administation team weeks to gather manually.

    Rick Kelly
    Senior Database Systems Engineer, National Organization for Research

    SQL Diagnostic Manager makes our team more efficient and proactive. We rely on it to keep our SQL Server infrastructure healthy and our critical applications performing well.

    Tom Sawyer
    Senior Database Administrator, Franciscan Health

    With SQL Diagnostic Manager, we realized significant productivity gains and cost savings, thanks to more granular alearting capabilities and faster troubleshooting of potential disastrous issues.

    John Grover
    Database Administrator, University of Notre Dame

    50,218 users joined this month

    Join 50,000+ Database Professionals

    Start monitoring your SQL Server instances in minutes. Get instant insights, automated alerts, and peace of mind.

    • Free 14-day trial
    • No credit card required
    • Setup in 5 minutes
    FAQ

    Frequently Asked Questions

    Everything you need to know about SQL Diagnostic Manager

    What is SQL Server performance monitoring?

    SQL Server performance monitoring is the practice of continuously tracking key database metrics — CPU, memory, I/O, TempDB usage, wait statistics, blocking, and query execution — to understand system health and catch problems before they affect end users. Rather than a one-time check, effective monitoring is ongoing and combines real-time visibility with historical baselines, so DBAs can distinguish normal fluctuation from a genuine anomaly. It typically spans every layer of the environment: the SQL Server engine itself, the underlying OS, storage, virtualization, and — for hybrid or cloud deployments — resources in Azure, AWS, or GCP. Mature monitoring goes beyond alerting on thresholds to include root-cause analysis and prescriptive tuning guidance, helping DBAs move from “something is slow” to a specific, actionable fix. Tools like SQL Diagnostic Manager formalize this practice at scale, giving DBA teams a single, consistent way to monitor performance across on-premises, virtual, and cloud SQL Server instances without switching platforms or building custom scripts.

    What database performance monitoring tools are best?

    The best database performance monitoring tools combine real-time visibility with predictive alerting, so issues are flagged before users are affected rather than after. Look for query-level observability — execution plans, wait stats, blocking chains, and TempDB pressure — not just surface-level CPU and memory graphs, since root-cause analysis depends on that depth. Cross-tier visibility matters too: the strongest tools trace an issue from the database engine down through the OS, storage, and virtualization layer, and across cloud platforms like Azure, AWS, and GCP. Agentless deployment reduces overhead and security surface area, especially at scale. Predictable, per-instance pricing (rather than ingest-based pricing) keeps costs manageable as environments grow. Independent, third-party comparisons and analyst reviews (such as those from Gartner Peer Insights or TrustRadius) are a useful way to validate vendor claims. SQL Diagnostic Manager is built around these principles — real-time, cross-environment monitoring with prescriptive analytics and AI-powered optimization — for teams managing SQL Server at scale.

    Does SQL Diagnostic Manager work for enterprise?

    Yes — SQL Diagnostic Manager is built to scale across large, complex SQL Server estates, which is a core enterprise requirement. It supports centralized, cross-instance monitoring so DBA teams can track hundreds of servers from unified, normalized dashboards spanning on-premises, virtualized, hybrid, and multi-cloud environments (Azure SQL Database, Azure SQL Managed Instance, AWS RDS, and GCP). Enterprise-grade features include a customer-owned repository for multi-year forensic analysis and compliance-ready reporting, predictable per-instance pricing with no ingest fees, and comprehensive out-of-the-box reporting that’s also fully customizable for internal audit and governance needs. Agentless architecture minimizes deployment overhead across large numbers of servers, while integrations like PowerShell scripting and Microsoft SCOM support existing enterprise operations workflows. Role-based access, permissioned AI features, and full audit logging of AI interactions further support enterprise security and compliance requirements. For organizations managing SQL Server at scale, SQL Diagnostic Manager is designed to provide consistent, centralized visibility without sacrificing depth or control.

    Does SQL Diagnostic Manager work for teams?

    Yes — SQL Diagnostic Manager is designed for collaborative, team-based database administration, not just individual DBA workflows. Centralized dashboards give every team member the same real-time visibility into SQL Server health, so work isn’t siloed to whoever originally set up monitoring on a given instance. Built-in expert advice and prescriptive tuning guidance help less experienced team members resolve common issues without waiting on a senior DBA, while ranked recommendations with executable scripts standardize how the team responds to recurring problems. Predictive and customizable alerts can be routed to the right people, reducing noise and clarifying ownership. AI-powered features include permission controls, so admins can grant access selectively across the team, along with full logging of every AI submission for accountability and review. Whether a team is small and generalist or large and specialized by environment (cloud, on-prem, virtualization), SQL Diagnostic Manager’s shared visibility and consistent tooling help teams work from the same data instead of fragmented, ad hoc scripts.

    Does SQL Diagnostic Manager work for single users?

    Yes — SQL Diagnostic Manager is equally practical for a single DBA managing SQL Server on their own, not just large teams. Agentless deployment means a solo administrator can get monitoring running quickly without provisioning and maintaining agents across every instance. The Performance Analysis Dashboard and SQL GUI give one person a consolidated, real-time view of database health without needing to manually run and interpret DMV queries or Extended Events sessions. Built-in expert advice and prescriptive tuning guidance are especially valuable for a single administrator, since they provide guidance that might otherwise require consulting a second, more senior DBA. Predictive alerting also matters more without a team to divide monitoring duties — it reduces the chance that a single person misses a developing issue while focused elsewhere. For independent DBAs or small shops without a dedicated database team, SQL Diagnostic Manager effectively provides the diagnostic depth of a larger team’s tooling in a single console.

    How do I analyze SQL query performance?

    Analyzing SQL query performance starts with isolating where a query is actually spending its time — execution plan history and wait stats analysis reveal whether it’s blocked by another session, stalled on I/O, waiting on locks, or simply running an inefficient plan. Query Store integration adds historical context, letting DBAs compare a query’s current execution plan and runtime against how it performed previously, which helps distinguish a genuine regression from normal variability. From there, check for missing, fragmented, or unused indexes, since poor indexing is one of the most common and fixable causes of slow queries. TempDB pressure and blocking chains are also worth ruling out, particularly for queries that only slow down under load. AI-powered query comparison takes this further, analyzing execution patterns across competing queries in a workload — not just a single query in isolation — to recommend balanced, workload-aware index changes, with every recommendation reviewed and approved by the DBA before implementation.

    How can you monitor database performance?

    Monitoring database performance requires continuous, real-time data collection across the full stack — not just the database engine, but the underlying OS, storage, and virtualization layer, plus cloud resources for hybrid or multi-cloud deployments. Effective monitoring tracks core metrics (CPU, memory, I/O, TempDB, wait stats) alongside query-level detail like execution plans and blocking chains, then compares current behavior against a historical baseline to catch meaningful deviations rather than normal noise. Predictive alerting extends this from passive tracking to proactive warning, flagging developing issues — like rising TempDB pressure or a growing blocking chain — before they escalate into outages. Agentless tools reduce the operational burden of deploying this kind of monitoring across many instances. Beyond raw visibility, the most useful monitoring turns data into action: fragmentation analysis with automatic recommendations, replication and health scoring, and prescriptive tuning guidance for CPU, memory, and query performance all help DBAs move from observation to resolution faster.

    What are the most important metrics for SQL Server performance monitoring?

    The most critical metrics span both resource-level and query-level performance. On the resource side: CPU utilization, memory pressure (including buffer cache and page life expectancy), disk I/O latency, and TempDB usage and contention are foundational, since bottlenecks here cascade into broader slowdowns. Wait statistics are equally important — they show exactly what SQL Server is waiting on (locks, I/O, CPU scheduling), which is often more diagnostic than raw resource usage alone. On the query side, track execution plan changes, query duration trends, and blocking or deadlock frequency, since these reveal problems that resource metrics alone can miss. Index health — fragmentation levels and missing or unused indexes — rounds out the picture, since indexing issues are a leading cause of degraded query performance. For cloud and hybrid environments, cost metrics (via cloud tagging) are increasingly treated as a performance-adjacent metric, since cost spikes often correlate with inefficient query or resource patterns. Tracked together against a historical baseline, these metrics give DBAs a complete, actionable picture of SQL Server health.

    Where can I learn more detailed information about the new AI Powered capabilities of SQL Diagnostic Manager?

    For a full breakdown of SQL Diagnostic Manager’s AI-powered performance optimization — including how workload-aware index recommendations are generated, what data is (and isn’t) sent to IDERA AI, and the manual approval controls built into every step — visit the dedicated AI FAQ page. It covers practical details DBAs and security teams typically want answered before enabling AI features: that AI is disabled by default and requires admin-level opt-in, that no table data is ever submitted to IDERA AI, that every query and schema submission requires manual user review and approval, and that all AI recommendations — including index changes — must be manually reviewed and copy/pasted rather than applied automatically. The page also details full audit logging of AI activity and the permissioning model for controlling which users can access AI features. It’s the most current, authoritative source for how AI works inside SQL Diagnostic Manager today.

    Still have questions?

    Our team is here to help you get started

    Ready to Transform Your Database Monitoring?

    Join thousands of DBAs who have improved their SQL Server performance with our comprehensive monitoring solution.
    • 14-day free trial with full access
    • No credit card required
    • Setup in under 5 minutes
    • Cancel anytime, no questions asked

    Already a customer and looking to upgrade?
    Get the latest version here.

    Note: By filling and submitting this form you understand and agree that the use of IDERA’s website is subject to the General Website Terms of Use. Additional details regarding IDERA’s collection and use of your personal information, including information about access, retention, rectification, deletion, security, cross-border transfers and other topics, is available in the Privacy Policy.

    If you would like to speak with a representative, then please call +1 (713) 523-4433.