DB Optimizer Product Tour
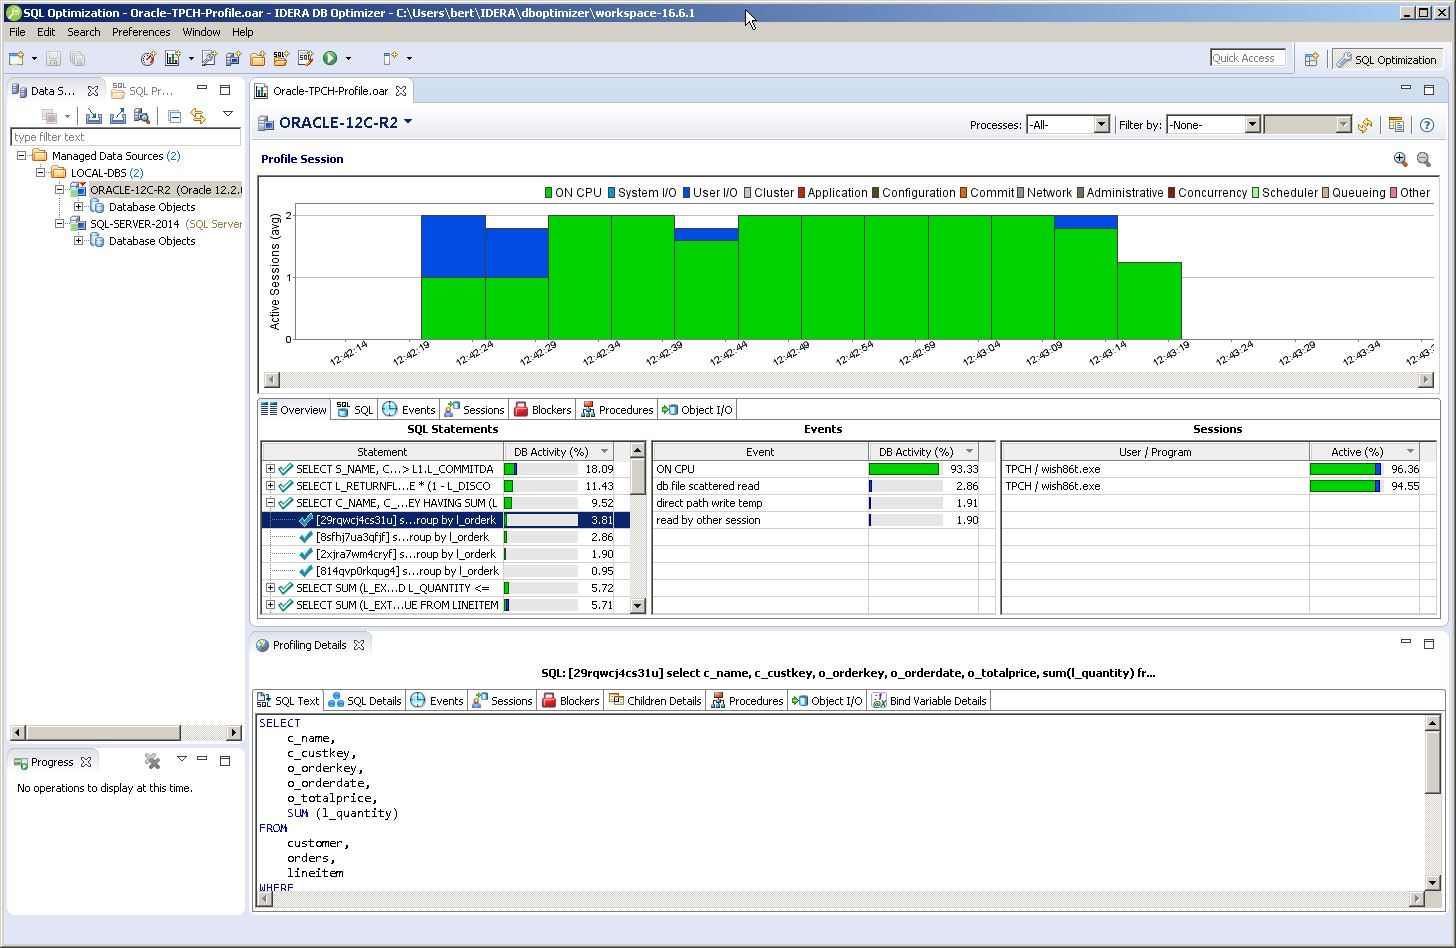
Profile SQL execution performance: Identify and diagnose performance bottlenecks and problematic SQL without agents or placing a significant load on the target database. The profile chart shows the CPU, I/O, and other wait activity over the course of the session, in real-time while profiling is in progress. Drill down into the execution details for any given statement, including the SQL text, events, sessions, child cursors, blockers, procedures, and SQL details.
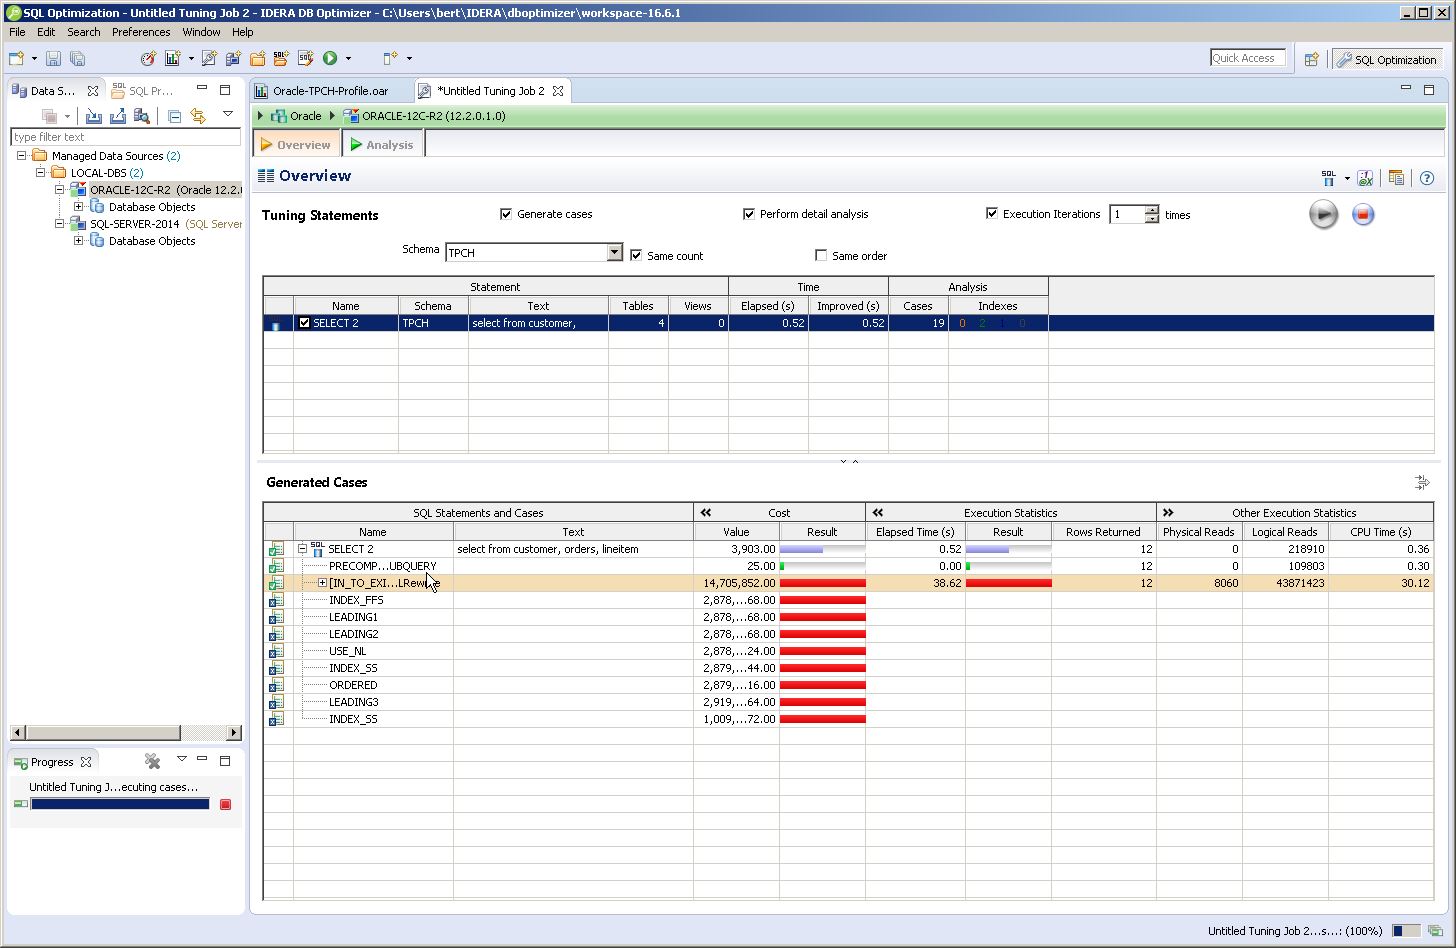
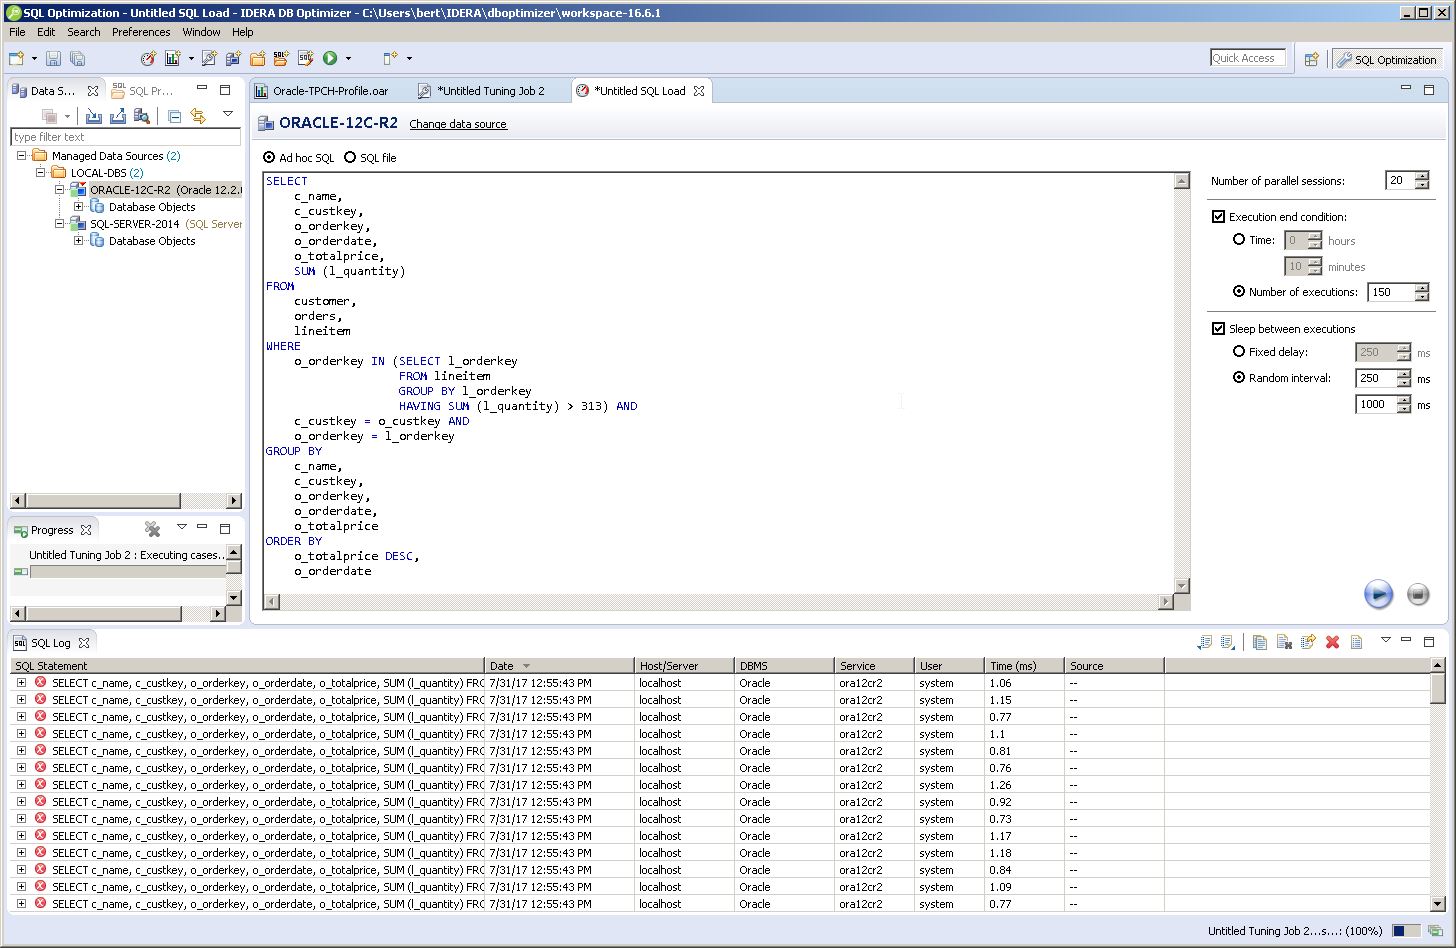
Generate SQL statements and cases: Create and run tuning jobs for a single statement or batch of statements. Tune all DML statements, stored routines and entire SQL files. View execution statistics for SQL statements and cases. SQL rewrites are suggested as part of the case generation in the SQL tuner as well as when you type in the SQL IDE.
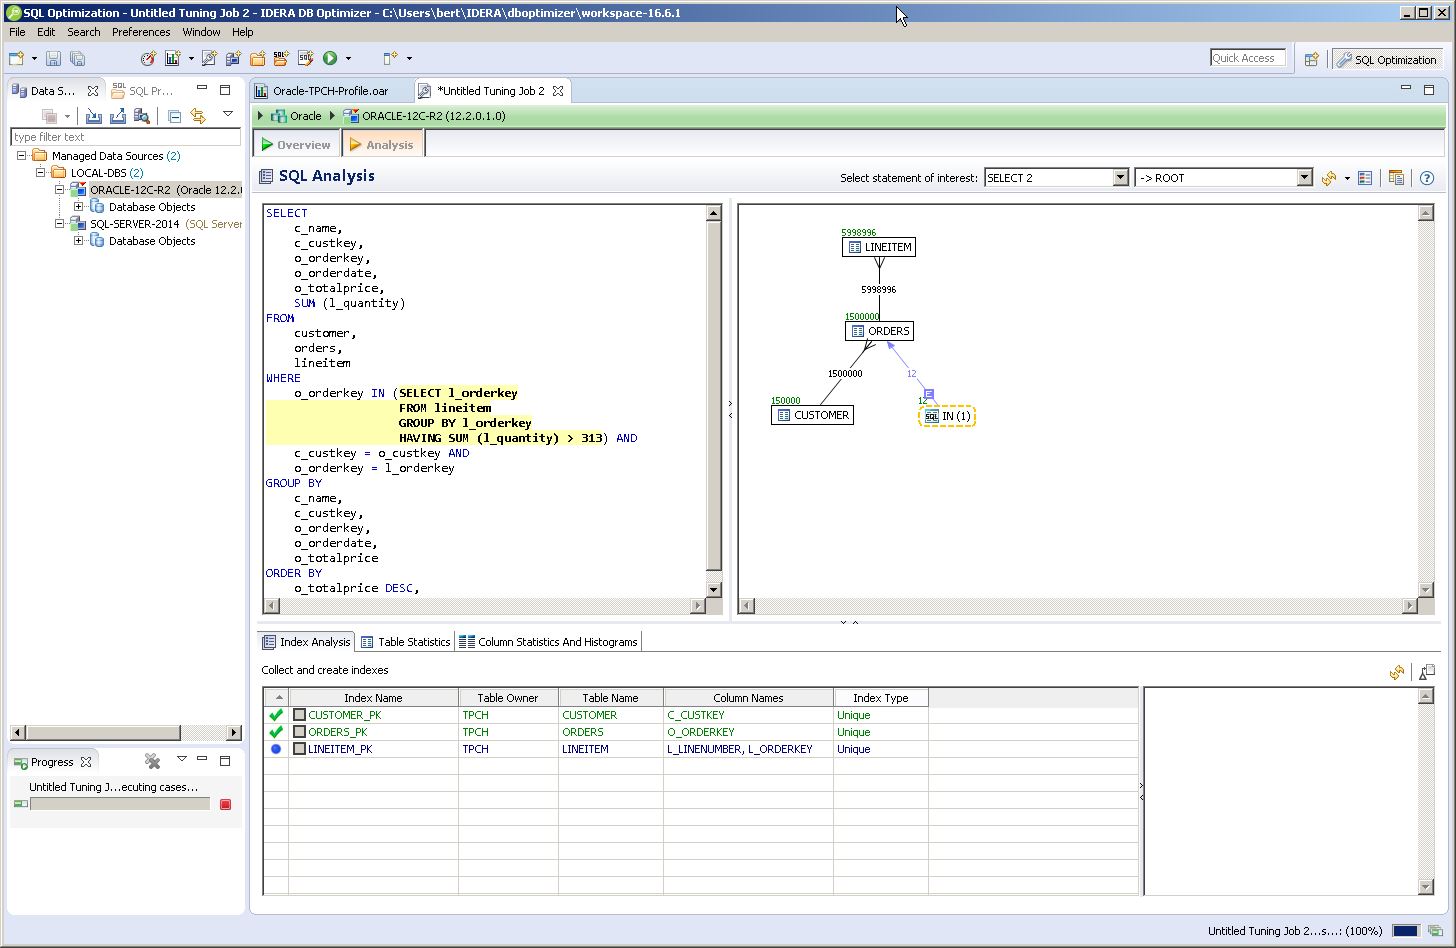
Tune SQL like a pro: The SQL tuning wizard automatically suggests solutions for tuning SQL code. The color-coded Index Analysis shows used, not used, or missing indexes and offers recommendations for optimum performance. Find the best alternative to a given SQL statement by including SQL rewrites and hint injections.
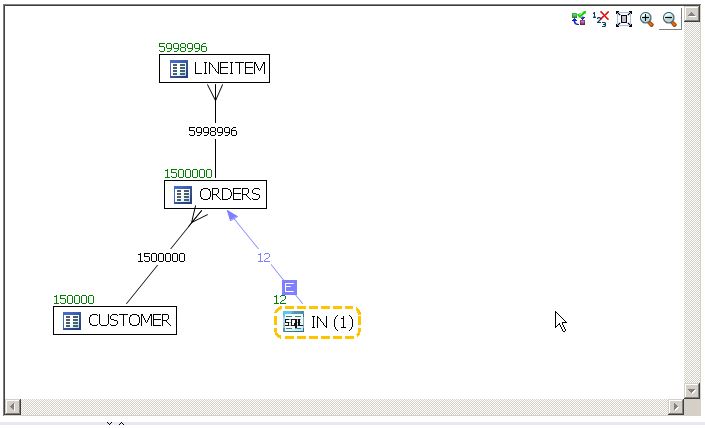
Visually tune complex SQL queries: Unique in the industry, Visual SQL Tuning (VST) diagrams turn text-based SQL code into graphical SQL diagrams to show the impact of SQL statements on the database. The VST diagram displays indexes and constraints on tables and views with table statistics, as well as the joins used in a SQL statement.
