















SQL Server performance monitoring
Stop chasing alerts.
Start seeing the real cause now.
- N14-day full-feature trial
- NNo credit card
- NAgentless - live in ~5 min
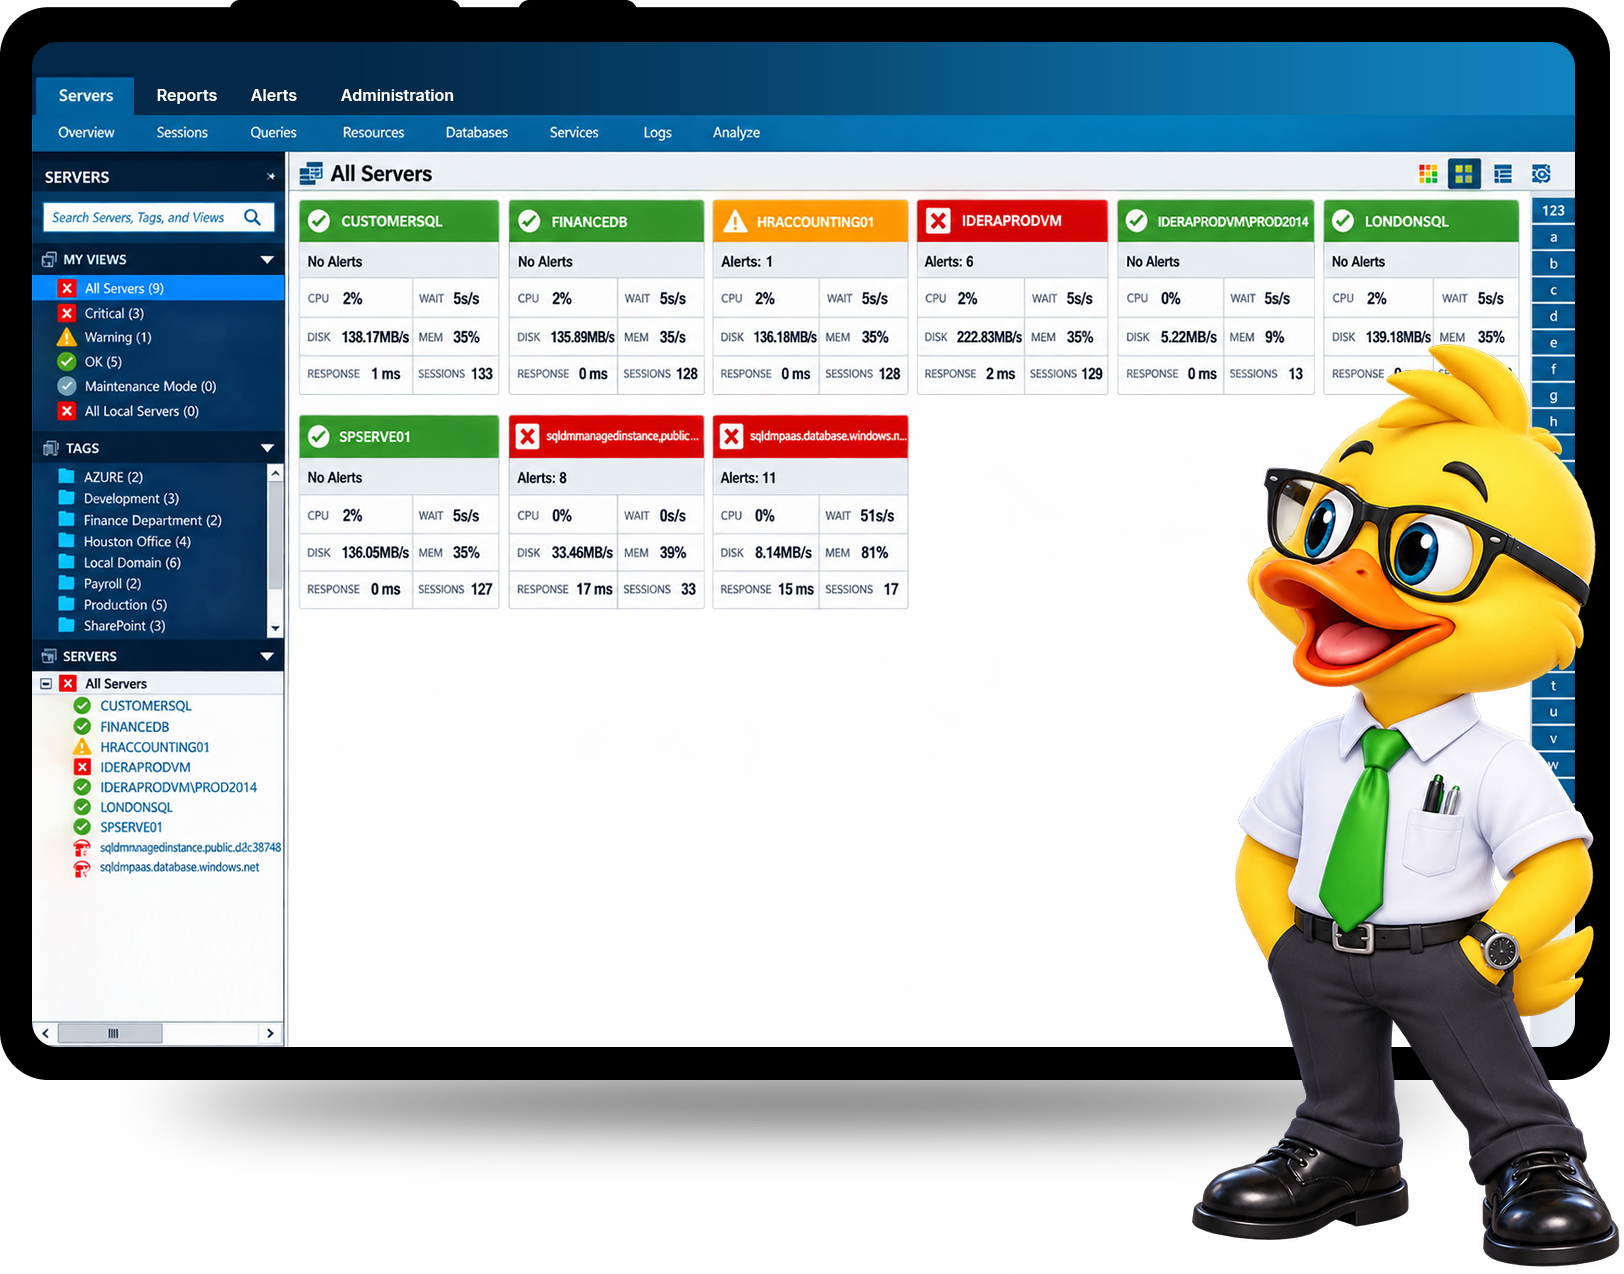
Trusted by 50,000+ database professionals worldwide

The problem every DBA knows
When an alert fires, does it mean something - or is it just background noise?
- Life on defaults
Alert fatigue & guesswork
- Generic thresholds cry wolf until the team tunes them out.
- Deadlocks reconstructed by hand from error logs, hours later.
- "Something's slow" - but no way to see who, what, or where.
- Capacity conversations run on gut feel, not data.
- With SQL DM
Alerts you can trust
- Adaptive baselines learn each server's normal and fire on real anomalies.
- Deadlocks captured and visualized automatically — the evidence is waiting.
- Waits broken down by database, user, application and query.
- Forecast disk, database and table growth from your own history.
One platform
See every layer. Solve the problem faster.

Deep root-cause insight

Act automatically

Everywhere you run SQL

Own your data
Where it earns its keep
The capabilities DBAs reach for first
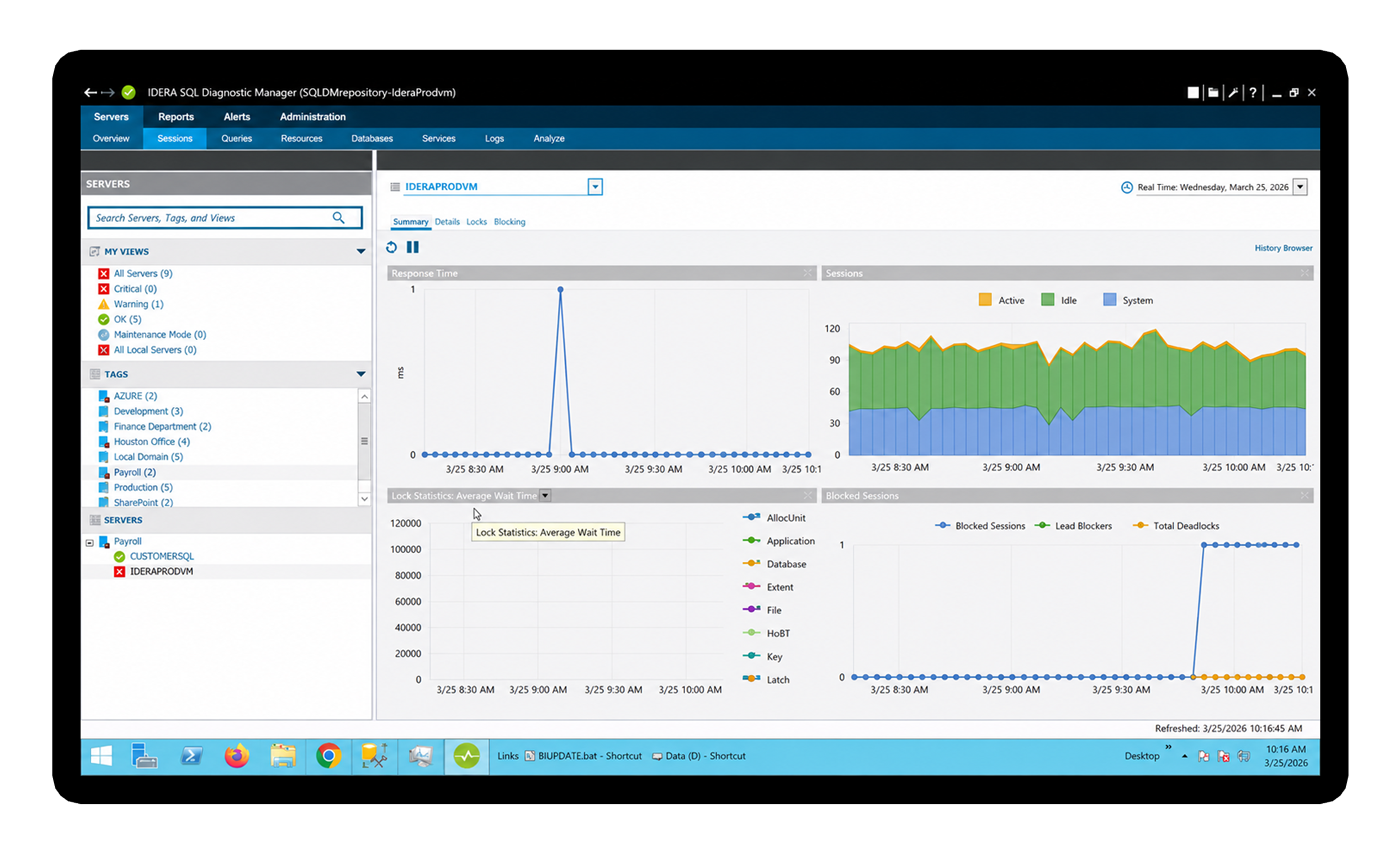
Deadlock detection & analysis
The evidence is already captured.
Deadlocks are intermittent, hard to reproduce and painful to chase through error logs after the fact. SQL DM captures every deadlock event automatically and visualizes it — the exact queries and resources on both sides of the conflict.
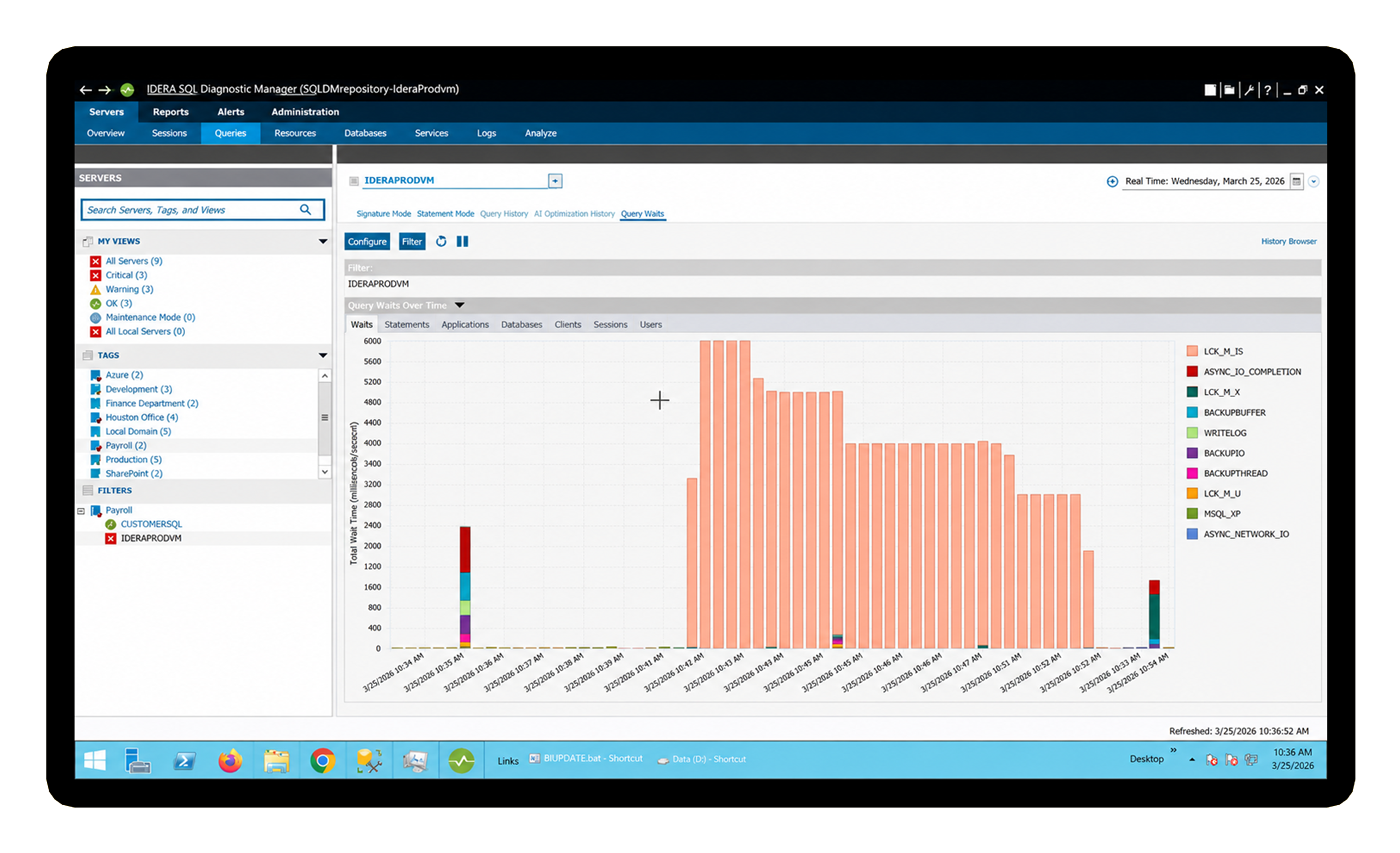
Wait statistics analysis
Not just “what’s slow.” Who and where.
Most teams only see instance-level waits. SQL DM slices wait data by database, by user, by application and by individual query — so you can hand the finding straight to the right person instead of guessing.
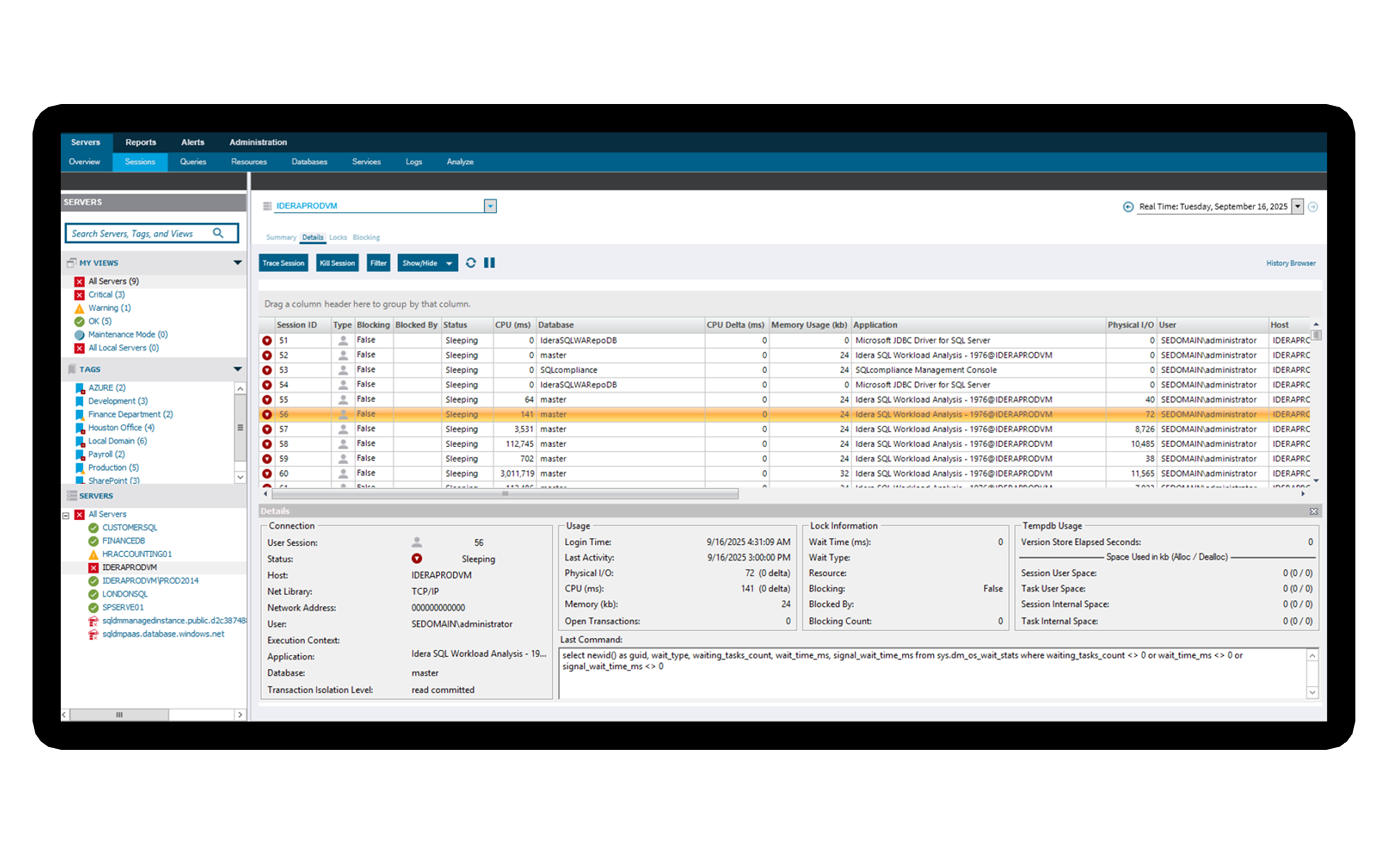
Session monitoring
A live window into every connection.
See exactly what's happening right now — who's connected, what they're running, how long it's taken and what it's consuming. Blocking chains surface in real time, so you act at the moment of impact instead of reconstructing it later.
Forecasting & capacity planning
Turn a budget request into a data point.
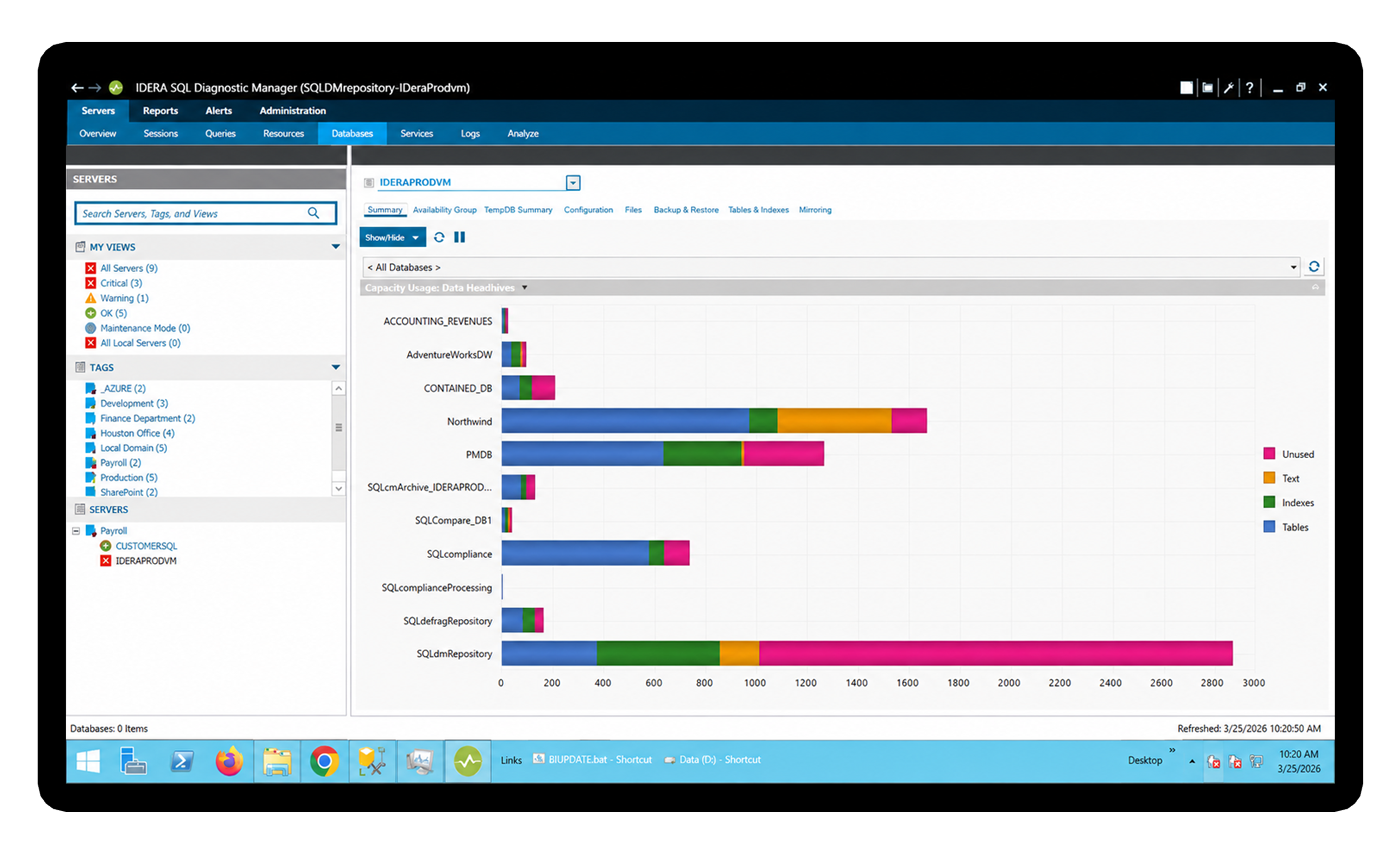
SQL DM projects disk, database and table growth forward from the patterns it's already collecting in your environment — no guesswork. Walk into the leadership conversation knowing which databases are growing fastest and when you'll run out of runway.
All in one license
Everything you need to monitor, tune and prove it

Baseline & dynamic thresholds
Learn what normal looks like for each server, then alert on genuine anomalies instead of generic limits. This helps reduce alert fatigue and keeps attention on issues that actually matter.

Alert actions & automation
Trigger scripts, ServiceNow tickets, paging, and SNMP traps when issues appear. Problems can be resolved or fully documented before users even notice.
Forecasting & capacity
Project disk, database, and table growth based on real observed usage patterns. This gives teams the data they need to support storage requests and plan ahead with confidence.

Live session monitoring
See active connections, running queries, and blocking chains in real time. DBAs can understand the impact as it happens instead of investigating after the damage is done.

Deadlock visualization
Capture every deadlock automatically, including the exact queries and resources involved on both sides of the conflict. This makes it easier to diagnose the root cause and prevent repeat issues.

Dimensional wait stats
Break down waits by database, user, application, and query. This gives DBAs a clearer path to the true source of pressure instead of chasing surface-level symptoms.

TempDB monitoring
Track space usage, session consumption, version store activity, and allocation contention in one focused view. DBAs can catch TempDB problems early, before they turn into failures.
History browser
Rewind to any moment and see the full monitoring picture as it existed at that time. This is especially useful for post-incident forensics, troubleshooting, and validating changes.

Replication monitoring
Monitor latency, distributor status, and agent health from the same console. Teams can spot replication issues early and alert before lag becomes a business problem.

AlwaysOn AG health
Track sync state, log send queues, redo queue depth, and failover readiness. These early signals help DBAs identify availability risks that native tooling may not clearly surface

VM & virtualization awareness
View hypervisor metrics alongside SQL Server metrics, including CPU ready, memory ballooning, and host disk latency. This helps teams recognize when a slow query is caused by infrastructure, not SQL Server.

Prescriptive recommendations
Get specific, prioritized guidance on what to fix based on what the tool sees in your environment. It acts like an expert advisor that helps DBAs move from diagnosis to action faster.

Custom counters
Pull in Windows PerfMon counters, custom DMVs, and application-level KPIs alongside SQL Server metrics. This gives teams a more complete view of performance in one place.

Scheduled reporting
Automatically distribute performance reports on any cadence. There is no need for manual exports, and teams can keep leadership informed with consistent, organized reporting.

Prescriptive & AI insights
Use AI-powered query optimization and side-by-side comparisons of AI-generated recommendations against the original query. These new capabilities add another layer of guidance to the SQL Server tuning toolkit.
Why teams choose SQL DM
Enterprise-grade coverage. On your terms.
0
agents on your servers — full data collection with minimal overhead.
$0
ingest fees. Predictable per instance pricing you can budget for.
Years
of forensic history in a repository you own outright.
1000s
of instances monitored from a single pane — without performance impact.
Time to value
Monitoring your estate in about five minutes
Install & connect
Point SQL DM at your instances — on-prem, cloud or hybrid. Scripted installs make estate-wide rollout painless.
Baselines learn your normal
Out-of-the-box thresholds get you covered immediately, while adaptive baselines quietly learn what “healthy” looks like for each server.
See signal, act, prove it
Trusted alerts, one-click root cause, automated responses and scheduled reports for the people who ask “is it fixed?”
Loved by database professionals
The teams keeping SQL Server healthy

SQL Diagnostic Manager provides in minutes information that would take the whole database administration team weeks to gather manually.
SQL Diagnostic Manager makes our team more efficient and proactive. We rely on it to keep our SQL Server infrastructure healthy and our critical applications performing well.
With SQL Diagnostic Manager, we realized significant productivity gains and cost savings, thanks to more granular alerting and faster troubleshooting of potentially disastrous issues.
Good questions
Frequently asked
Is it really agentless - what's the overhead on my servers?
Does it work across cloud and hybrid, not just on-prem?
How is it priced - are there ingest or data fees?
Does it suit a single DBA, or only big teams?
What’s actually in the free trial?
Tell me about the new AI capabilities.
Start now
Ready to trust your alerts again?
- N14-day free trial with full access
- NNo credit card required
- NAgentless setup in under 5 minutes
- NCancel anytime, no questions asked