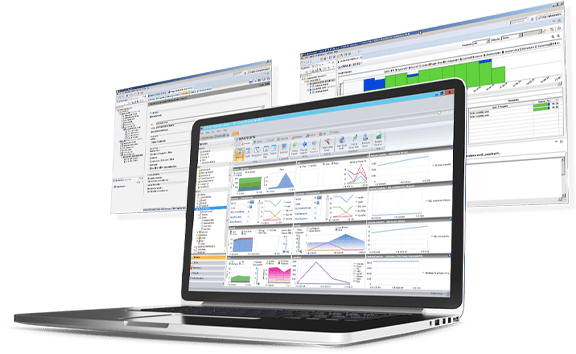
Performance Monitoring for SQL Server
Leverage SQL Server monitoring tools to improve
database performance with Idera SQL Diagnostic Manager

Proactively monitor
disk space usage to avoid
bottlenecks
SQL Diagnostic Manager enables database administrators (DBAs) to monitor their disk space usage with The Disk Space Usage Forecast tool. This tool allows DBAs to pinpoint current disk space needs while also forecasting how much free space your system may need in the future. This is made possible with a proven algorithm that automatically analyzes current disk usage and measures it against historical usage trends. This enables DBAs to easily determine when—and how much—more disk space may be needed. By proactively monitoring disk space in this manner, the Disk Space Usage Forecast tool enables DBAs to mitigate bottlenecks before they even occur.

Set SQL Server
performance baseline
metrics to identify issues
SQL Diagnostic Manager has built-in Baseline Statistics reporting functionality that enables DBAs to analyze and compare SQL Server performance baselines over time. The Baseline Statistics report can run within a single SQL Server instance, or be run across two instances, empowering DBAs to easily identify trends in performance statistics across their system. With performance baselines established, DBAs can improve capacity planning, troubleshoot issues faster, and be alerted when SQL Server activity metrics fall below accepted thresholds.

Get real-time alerts with
custom and out-of-the-box notification settings
SQL Diagnostic Manager alerting is highly customizable to each organization’s needs, with numerous custom and turnkey alert options to inform and warn DBAs about approaching issues. When a SQL Server event alert threshold is reached, SQL Diagnostic Manager can:
- Send an email notification to the assigned DBA
- Pop up an alert message in your Windows taskbar
- Write an event to the Windows Event log
- Generate an event on the Timeline
In addition, alerts can be customized at the database and disk-level, enabling DBAs to set unique thresholds within any monitored SQL Server instance.

Prioritize resources to
address critical issues
Most SQL Server performance issues can be tied back to resource bottlenecks, which is SQL Diagnostic Manager is designed to enable DBAs to closely monitor system resources to prevent slowdowns or other issues before they ever occur. Using The Resources Summary feature, DBAs can monitor key diagnostic statistics on real-time charts to ensure that the computer on which your SQL Server resides is running smoothly. Easily monitor resources allocations like disk reads/seconds per disk, OS Memory Usage, SQL Server Memory Usage (Percent) and more. DBAs can even set custom alert thresholds to ensure no warning signs go unnoticed.
Frequently-Asked Questions
The best way to resolve SQL Server performance issues is proactive monitoring. Preventing performance degradation is the easiest and most effective way of avoiding performance issues, but of course, it’s not always possible. In those cases, DBAs should follow a process of monitoring, troubleshooting, diagnosing, and repair. First, they should monitor the database to isolate the symptoms of the problem, then diagnose the root cause and seek potential repairs.
The most common SQL Server performance issues include CPU bottlenecks, I/O bottlenecks, missing indexes, blocking, and resource contention, which can all contribute to general workload slowdown, query timeouts, connection timeouts, memory pressure, and other problems that can interfere with work and productivity if not prevented or quickly addressed.
SQL Server runs on the Microsoft Windows operating system, which means that it relies on the underlying system resources for performance. As a result, database system performance depends heavily on the central processing unit (CPU), memory, disk I/O, and network. SQL Diagnostic Manager helps DBAs stay apprised of CPU usage and other resource usage to prevent bottlenecks and reduce wait times.
Drive space forecasting is a feature of SQL Diagnostic Manager that allows DBAs to predict how much disk space may be needed in the future, based on current and historic growth rate trends. This enables DBAs to accurately predict when they’ll need increased drive space and to act accordingly before slowdowns or bottlenecks ever occur.
SQL Server performance hinges on strong database design, so performance improvements generally occur as a result of improved or streamlined design, or due to improved or increased resources. Actions such as choosing the appropriate data type and keeping clustered indexes small can have an outsize impact on performance, as can freeing up additional disk space when needed.
SQL Server alerting needs vary widely from organization to organization; there’s no one-size-fits-all alerting solution, which is why SQL Diagnostic Manager features highly customizable alerting settings. When setting SQL Server alerts, organizations must consider the issues and metrics that they find most important, who needs to be alerted to those issues and metrics, and how quickly they need to be alerted. Preventing alert fatigue while also quickly addressing any issues requires striking a careful balance, one that looks different for each organization.
Learn more about
an industry-leading
SQL Server query
optimization tool.
SQL Diagnostic Manager
- Monitor and report on database performance
- Proactively address SQL Server issues with custom alerting
- Troubleshoot and improve poor database performance


