GETTING STARTED
with SQL Diagnostic Manager
.
Table of Contents
Purpose of This Document
Due to the depth and potential for customization of SQL Diagnostic Manager, it is possible to overlook features during the initial trial period. This text highlights often-missed and modifiable areas that give more complete control over management and reporting in SQL Server environments. For additional product information, visit the SQL Diagnostic Manager wiki page.
Introduction
SQL Diagnostic Manager is a powerful performance monitoring and diagnostics solution that proactively alerts administrators to health, performance, and availability problems within SQL Server environments.
Why Use SQL Diagnostic Manager?
- Easily manage and organize monitored instances of SQL Server.
- Identify the impact of slow-running queries and analyze query performance.
- View in-depth analysis of sessions running on monitored instances of SQL Server.
- Alert predictively, automate alert actions and responses, set up server baselines, and analyze alert patterns.
- Analyze prescriptively with expert recommendations and executable scripts.
- View past performance and plan future capacity.
- Monitor tempdb to identify and resolve contention and performance issues.
- Connect to other tools by sending alerts to other systems and integrating with SCOM.
- Access the mobile console to see the entire SQL Server environment on mobile devices from anywhere.
- Deploy Web-Based Reports via SSRS for comprehensive auditing.
- Adapt to specific needs with custom counters, dashboards, and reports.
- Audit activity by viewing the main actions performed in the SQL Diagnostic Manager environment.
- Manage large environments by accessing multiple repositories and publishing reports from multiple data sources.
System Requirements
- General: Microsoft Windows with .NET Framework and Internet Explorer
- Repository: Microsoft SQL Server on Windows and Linux
- Monitored Database Instances: Microsoft SQL Server on Windows and Linux
- Mobile Console Server:Microsoft Windows with .NET Framework and Internet Information Services
- Mobile Devices: Google Android, Apple iOS, BlackBerry RIM, Microsoft Windows Phone
- Desktop Devices: Microsoft Internet Explorer, Google Chrome, Mozilla Firefox, Microsoft Edge
- Cloud: SQL Diagnostic Manager runs on cloud virtual machines (such as Microsoft Azure VM and Amazon EC2) with Microsoft Windows. It monitors Microsoft SQL Server instances on cloud virtual machines (such as Microsoft Azure VM and Amazon EC2).
Refer also to the documentation SQL Diagnostic Manager requirements, IDERA Dashboard and web console requirements, and SQLDM Mobile and IDERA Newsfeed requirements.
Permissions
The mobile and newsfeed service account requires the following permissions. By default, setup program assigns the local system account to the mobile and newsfeed service. During install, enter credentials for a Windows user account or SQL Server login.
| PERMISSION | WHY IT’S REQUIRED |
| Log on as service | Allows the mobile and newsfeed service account to run as a service. |
| Read and write privileges on the mobile repository database | Allows the mobile and newsfeed service to receive and maintain performance and configuration data in the mobile repository. |
| SQL Server Privileges | Either a Windows user account or SQL Server login that includes system administrator privileges on the monitored SQL Server instances. |
Port Requirements
| PORT | WHERE | WHICH COMPONENT USES IT | WHY |
| Web console | |||
| 9292 | Web server for dashboard | IDERA Dashboard | Core services |
| 9290 | Web server for dashboard | IDERA Dashboard | Web application service |
| 9094 | Web server for dashboard | IDERA Dashboard | Web application monitor |
| 9291 | Web server for dashboard | IDERA Dashboard | Web application SSL |
| Mobile console | |||
| 25 | Mail server | Mobile and newsfeed service | Allows the mobile and newsfeed service to send notification emails. |
| 80 | Web server for mobile console | Mobile web application | Allows access to the mobile screens via a mobile device inside or outside corporate firewalls. By default, IIS uses port 80 for the local virtual directory, so check web server settings to pick an appropriate port for mobile. Specify a different port during install, or later when required to change this configuration. |
| 135 | Monitored instance | Collection service | Gather WMI data. |
| 5166 5167 |
Computer for product services | Product services | Allow communications between SQL Diagnostic Manager and the newsfeed platform for signup and login authentication. |
| 5168 | Computer for mobile and newsfeed services | Mobile and newsfeed services | Allows communications between the newsfeed and SQL Diagnostic Manager for server status updates. |
Architecture
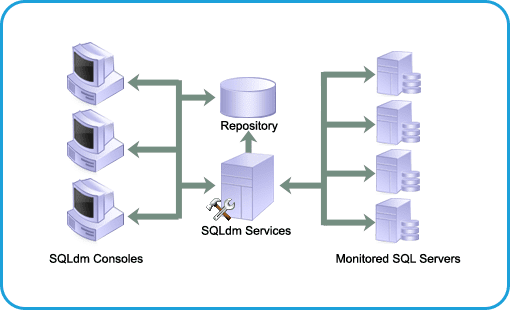
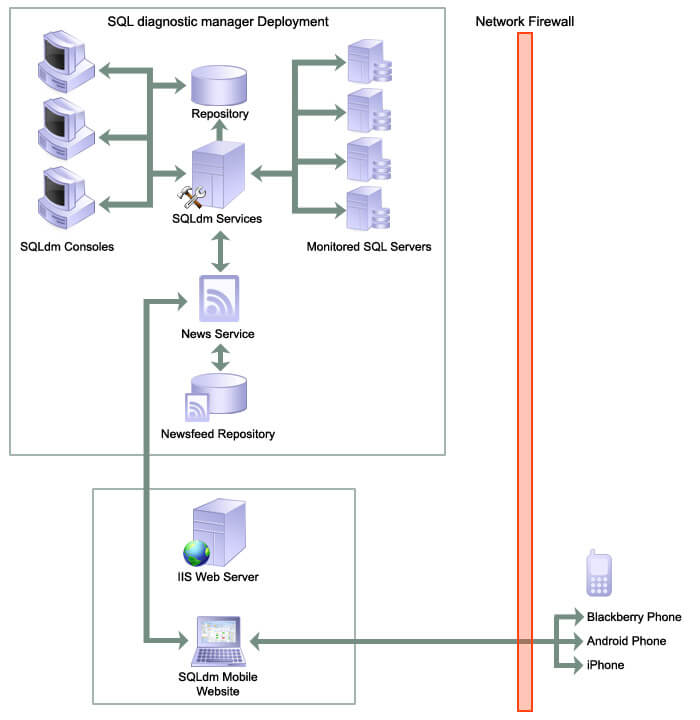
SQL Diagnostic Manager consists of a light, unobtrusive architecture that easily runs in SQL Server environments with minimal configuration. All components of SQL Diagnostic Manager run outside and separate from SQL Server processes. Refer also to the documentation SQL Diagnostic Manager components and architecture, IDERA Dashboard components and architecture, and SQLDM Mobile components and architecture including IDERA Newsfeed.
Desktop Console
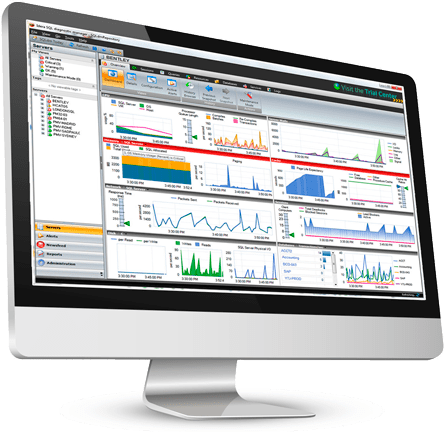
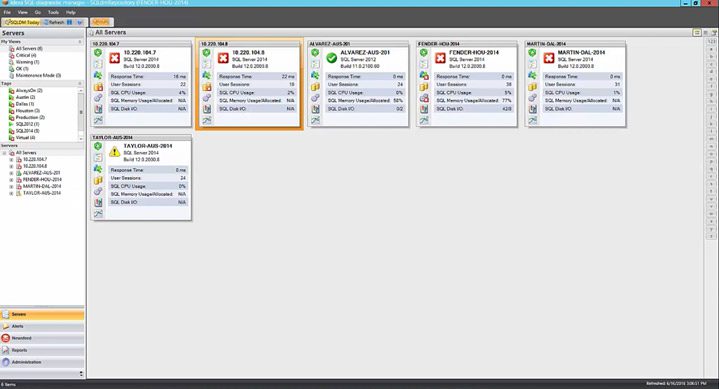
Use the desktop console to view real-time status, configure alert notifications on specific metric thresholds at the server and database levels, view historical reports, and perform administrative functions. The desktop console retrieves historical information directly from the repository. All real-time requests use the product services to poll the monitored SQL Server.
Product Services
SQL Diagnostic Manager has three centralized services that reside on the same computer:
- The management service provides real-time data to the desktop console, receives historical data from the collection service for storage in the repository, and raises alerts and sends alert notifications.
- The collection service performs on-demand and scheduled collection from the monitored SQL Servers.
- The predictive service calculates the alert forecast every hour and builds a forecasting model once per day.
Plug-In
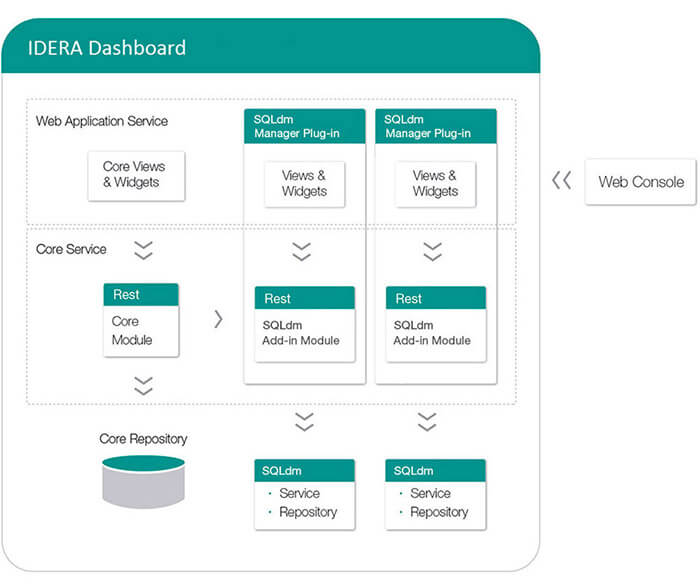
When registering SQL Diagnostic Manager with the IDERA Dashboard, this deploys the product plug-in module. The plug-in consists of web views and widgets and a .NET Framework based add-in module. This plug-in deploys the web views and widgets in the web application service of the IDERA Dashboard, and the add-in in the core service of the same. The web application service dynamically loads in the views and widgets and makes them available to web console users. The views and widgets use the representational state transfer (REST) application programming interfaces (APIs) of the add-in to retrieve data. Likewise, the add-in retries data from the product services and repository. Refer also to the documentation.
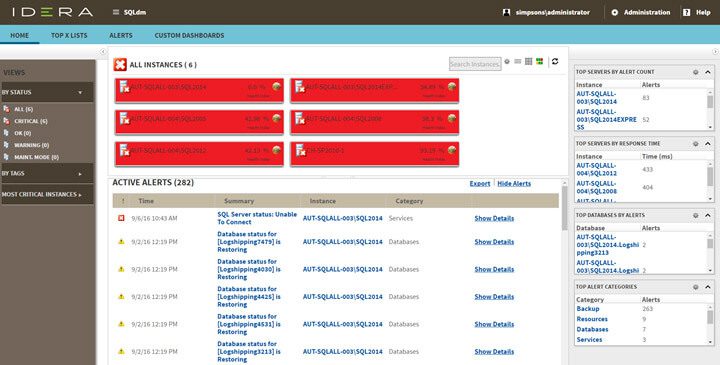
Web Console in IDERA Dashboard
The IDERA Dashboard and the web console install automatically upon upgrade or during installation of version 9.0 higher of SQL Diagnostic Manager.
To access the web console:
- Open a web browser that is compatible with the web console requirements.
- Enter the product uniform resource locator (URL) http://<machinename>:<port>.Here, <machinename> is the name of the host or machine, and <port> is the port specified during installation. The default URL is http://<localhost>:9290.
- When the web console launches on the web browser, use the Windows user account <domain\user> with the corresponding password to log into the product.
The web application service of IDERA Dashboard comes with secure socket layer (SSL) already set up. Refer also to the documentation Run IDERA Dashboard over SSL (HTTPS).
Repository
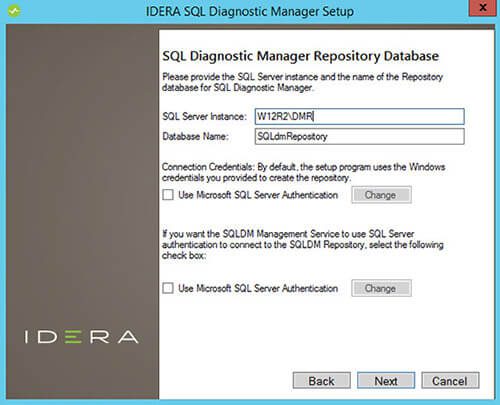
The repository is a centralized SQL Server database that stores collected metrics on a scheduled basis, historical data, and alerts information. The repository also stores configuration information, such as the credentials used to monitor a registered SQL Server instance. Refer also to the documentation Connect to the SQL Diagnostic Manager Repository.
Authentication
SQL Diagnostic Manager uses the same types of authentication that are available in the SQL Server security model. Use Windows Authentication or SQL Server Authentication when specifying account credentials for the product services. SQL Server Authentication is required when no domain trust exists between the product services computer and the computers hosting the monitored SQL Server instances. For example, if the monitored SQL Server instances are located in an untrusted domain or behind a firewall, use SQL Server Authentication to deploy SQL Diagnostic Manager successfully. In this case, use the system administrator (SA) account or a SQL Server login that has system administrator permissions.
Capabilities
Manage SQL Server Instances
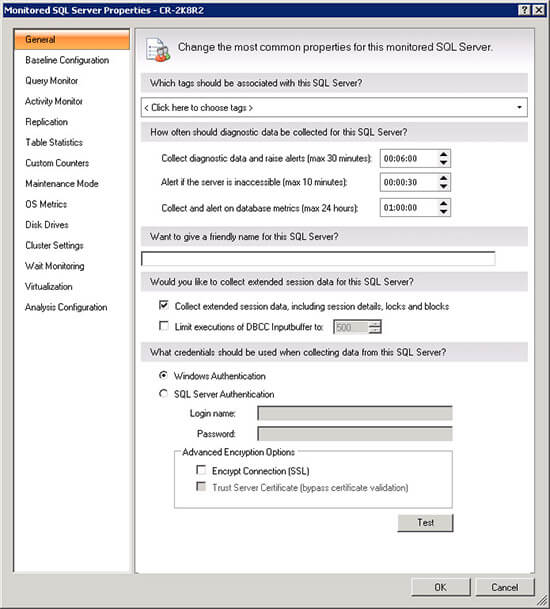
To add an instance to SQL Diagnostic Manager, select File > Manage Servers and follow the instructions in the Manage Server window. This window displays all of the SQL Server instances monitored by SQL Diagnostic Manager. After adding an instance, SQL Diagnostic Manager polls key performance metrics to start identifying which areas of the SQL Server environment need attention the soonest. Within seconds, identify areas of the environment that cause pain. These areas include areas that were not known to have a connection to experienced issues. Refer also to the documentation Manage your SQL Server instances and Add your SQL Server instances.
Organize Instances
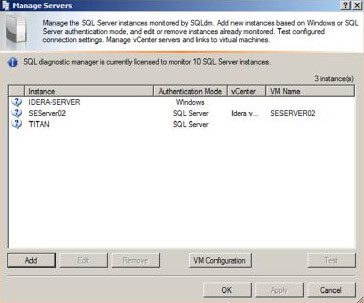
Apply one or more text-based labels to instances to ensure ease of management for reporting and user management, and creating an additional dashboard for each department, geographical location, and hosted customer. After tagging an instance, the instance belongs to a group. Selecting that group displays all members in a dashboard style view used to monitor and segment departments, locations, and versions for each thumbnail in the list. Change the display to show an overall view or details specific to any of the key performance indicators. Refer also to the documentation Work with tags.
Identify Impact of Slow-Running Queries
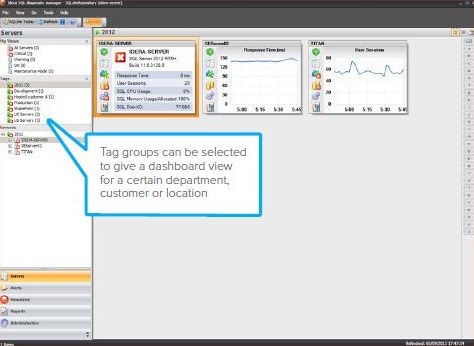
Identify slow-running code that is one of the main reasons for performance bottlenecks in SQL Server. The Query Monitor is a standard SQL Server trace that collects all of the events that occur on SQL Server instances over a period. Enable this option when experiencing query timeouts or other performance issues. Manually enable and disable the Query Monitor. Enable the Query Monitor automatically by using an alert action so that the Query Monitor does not have to be utilized all of the time but only for the periods that the Query Monitor is needed. Refer also to the documentation Set query monitor options.
Analyze Query Performance
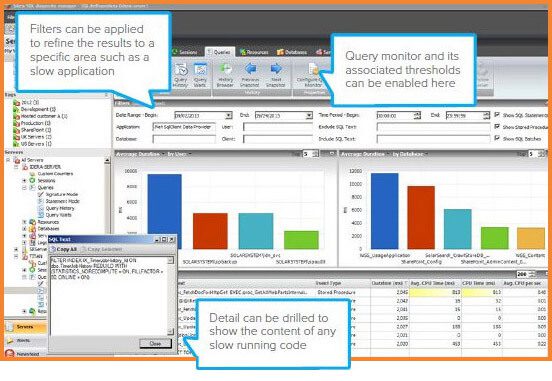
Analyze all queries or selected queries several different ways.
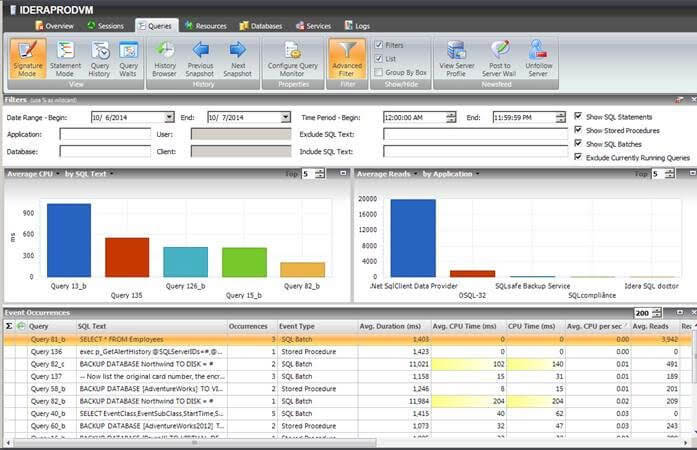
Signature Mode View (General Performance)
View individual SQL statements or to view query signatures. Query signatures are groupings of SQL Statements that match after stripping their literals. A query signature broadly defines queries and trends with a less overwhelming amount of data to diagnose a query in a general sense. After identifying a potential problem signature, drill into individual queries that make up the signature. Monitor average CPU, average reads, average writes, average duration, and number of occurrences. Refer also to the documentation View the query monitor signature mode and Advanced query signature view.
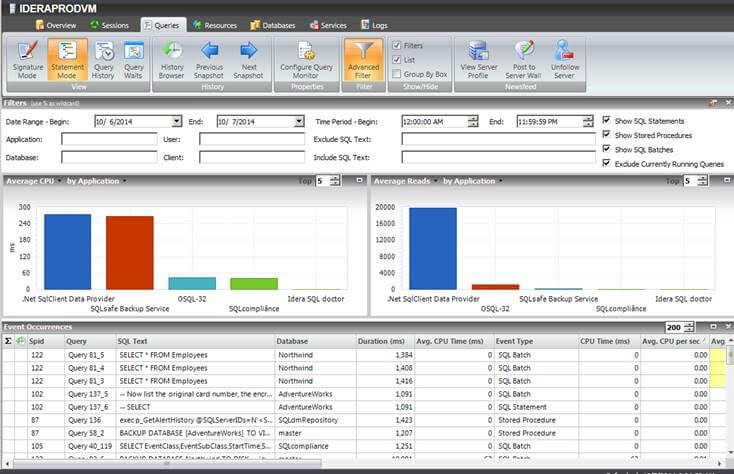
Statement Mode View (Specific Performance)
View individual SQL statements or view query signatures. Query statements are presented exactly as the query monitor trace collects them. Query statements provide all of the detail needed to diagnose a specific problem with a query. After identifying a potential problem statement, drill into the Query Details view. Monitor individual CPU time, individual reads, individual writes, and individual execution duration, as well as user database and application. Refer also to the documentation View the query monitor statement mode and Advanced query statement view.
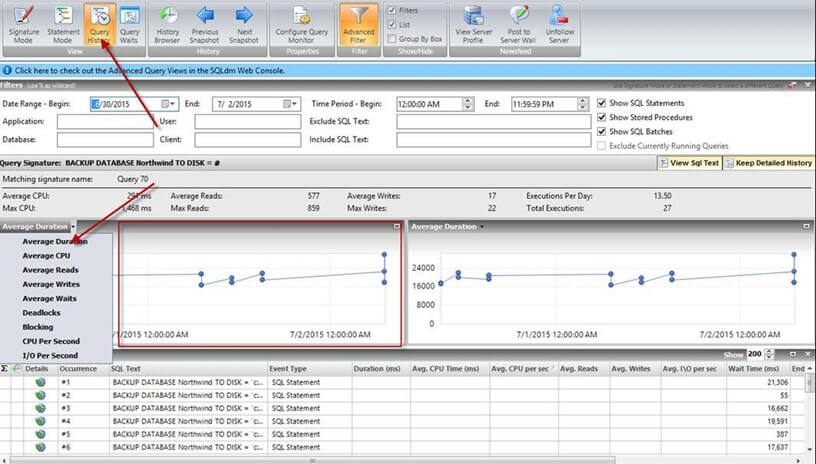
Query History View
Measure the daily historical performance impact based on number of occurrences throughout the day for every day. The history includes the durations, amount of CPU time each day, and the level of reads and writes. Understand historical trends for the selected query performance and how code changes may have improved performance into the future. Refer also to the documentation View the query history.
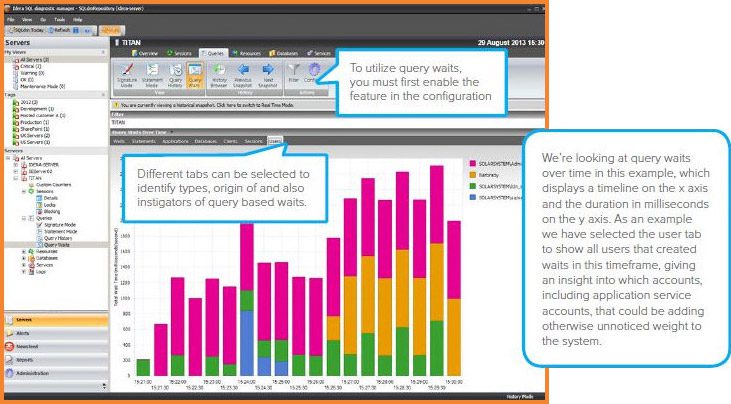
Query Waits View
Analyze waits over time and by duration to locate the top bottlenecks and what changes may potentially have the biggest performance boost on the SQL Server instance. Display a graphical dual view of query wait statistics to see an impact analysis of waits historically and to perform a real-time assessment of existing query activity and associated waits. Use the history browser in conjunction with wait stats for a very granular level of root-cause analysis when identifying performance bottlenecks in the past. Refer also to the documentation View query waits and View your SQL Server query waits information.
Execution Plan
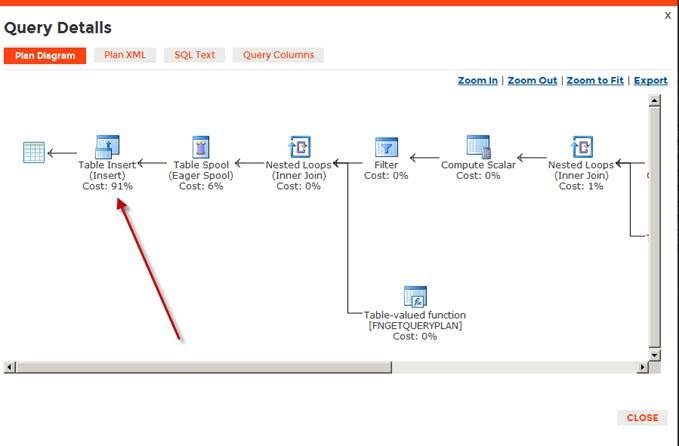
The execution plan assesses how queries perform and where to improve the code. The execution plan diagram displays the query execution plan (actual or estimated). The diagram shows the tree of operations that make up a query. This tree shows individual operation nodes and the pertaining graphical execution plan icon, along with basic information such as operator name and operation percentage of total cost. The execution plan also shows the referenced tables and columns to understand where a potential index adjustment may improve performance. Refer also to the documentation Query Details view.
Top Queries Report
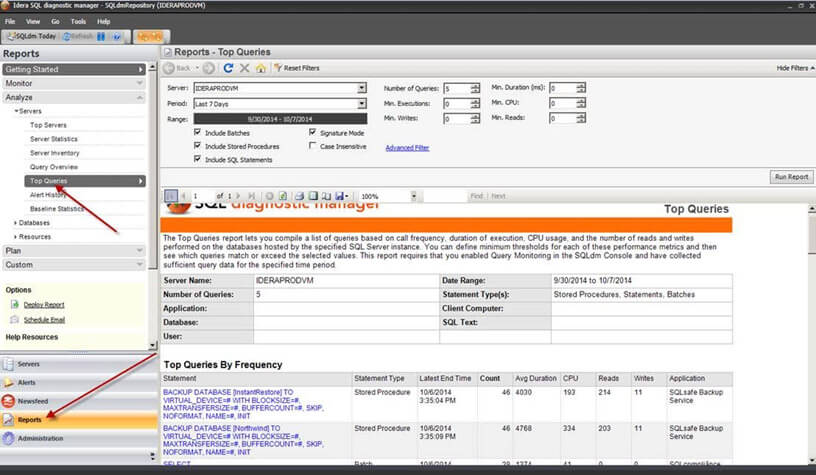
The Top Queries report compiles a list of queries based on call frequency, duration of execution, CPU usage, and the number of reads and writes performed on the databases hosted by the specified SQL Server instance. Define minimum thresholds for each of these performance metrics and then see which queries match or exceed the selected values. Report on the worst queries within the report interface. Apply some report filters such as filtering by user, database, application, host name, and by different performance criteria (such as CPU, memory, reads, and writes). Refer also to the documentation Top Queries server analysis report.
Queries Tab Filtering
On each Query tab, the filtering capabilities provide an option for focus on specific queries relevant to the performance. Include and exclude specific applications, databases, users, clients, SQL text, and more via advanced filters. Refer also to the documentation View your SQL Server queries information.

Prescriptive Workload Analysis
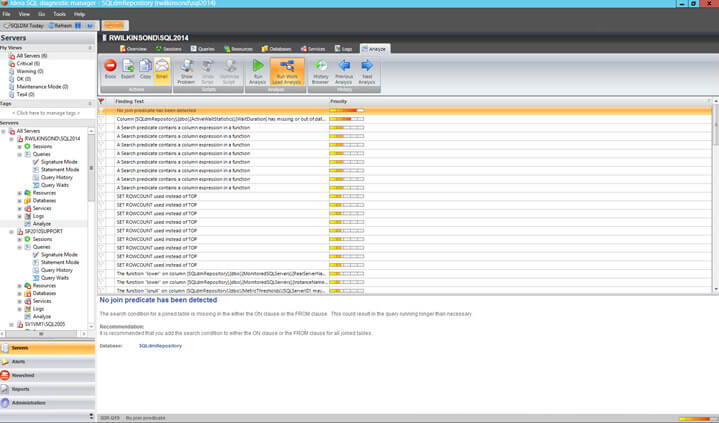
Run a prescriptive analysis on a specific SQL Server instance to identify and resolve SQL Server performance problems. The analysis engine scans the SQL Server configuration for potential problems and the health of the databases, resulting in a useful set of recommendations for improving performance. Prescriptive analysis targets some of the most common areas of SQL Server performance problems. Instead, workload analysis targets the performance categories for index optimization and query optimization. Workload analysis provides recommendations for these two categories that use a high amount of performance resources when running. Refer also to the documentation Run a workload analysis on your SQL Server.
SQL Workload Analysis Add-On
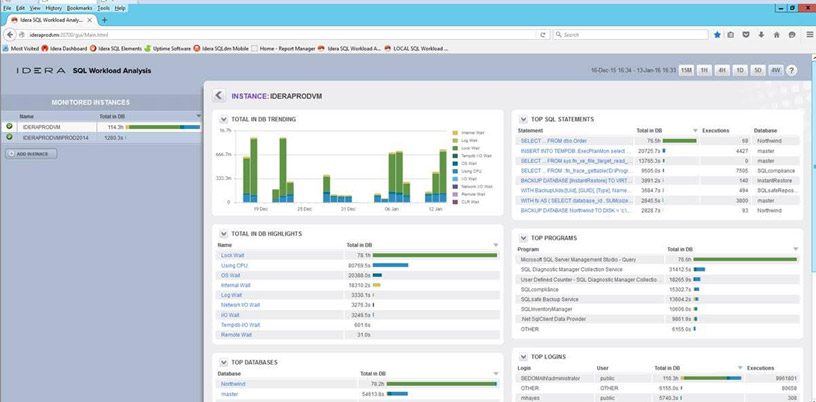
The SQL Workload Analysis add-on provides granular wait state monitoring, continuous SQL sampling, intuitive drill down to view top activity, query plan tuning and recommendations, lock and latch resolutions, and storage visibility and contention resolution. Identify, isolate, and resolve tough performance issues with specific SQL transactions or workloads in just a few mouse clicks. Refer also to the documentation Launch SQL Workload Analysis and Welcome to SQL Workload Analysis.
View Session Detail Analytics
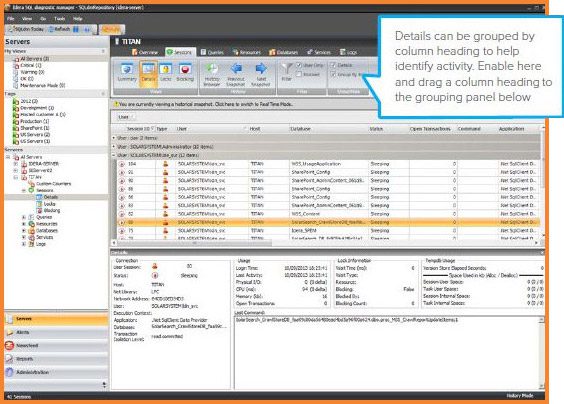
The Sessions Details view provides an in-depth analysis of sessions running on monitored SQL Server instances. View a broad range of information from performance details to open transactions and configured options. Track process activity at the statement level. Individual sessions appear in the top portion of the window. Right-click any session in the list to view locks, show the query history, trace the session, kill the session, print the associated statistics, and export statistics to Excel. Cross-reference information gathered from the Query Waits view to build a full and forensic picture of root cause analysis. Refer also to the documentation Get sessions performance details.
Alert Predictively
Configure alerts to inform and warn about approaching issues with SQL Server instances. See the alerts using the desktop and web consoles, the IDERA Newsfeed, and the mobile console. After correcting the situation triggering the alert, send alerts again if the situation recurs. Highlight columns containing associated alerts with their status color based on configurable thresholds. Identify trends in past alert activity and recognize the likelihood of the events happening going forward. Discover past trends in alert behavior and determine the percentage of likelihood that these same events may pop up at particular times later in time. Be better prepared to respond instead of reacting with surprise to alerts. Refer also to the documentation Alert on SQL Server Metrics.
Automate Alert Actions and Responses
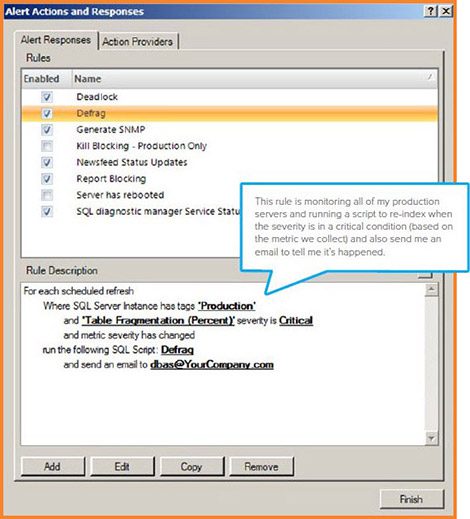
When reaching an alert threshold, automatically send an email notification, display an alert message in the Windows taskbar, write an event to the Windows Event Log, generate an event on the timeline, and execute a SQL or PowerShell script. Be informed very quickly to issues of health and performance, and implement steps to minimize and resolve issues and problems SQL Diagnostic Manager finds automatically. View a list of current rules used to assist in managing the SQL Server environment. Add new rules and modify existing rules. Generate multiple alerts for different levels of severity, metric, and time frame. Alert and report on custom counters. The breadth of alerting and management capabilities is vast. Refer also to the documentation Configure how SQL Diagnostic Manager responds to alerts.
Set Up Server Baselines
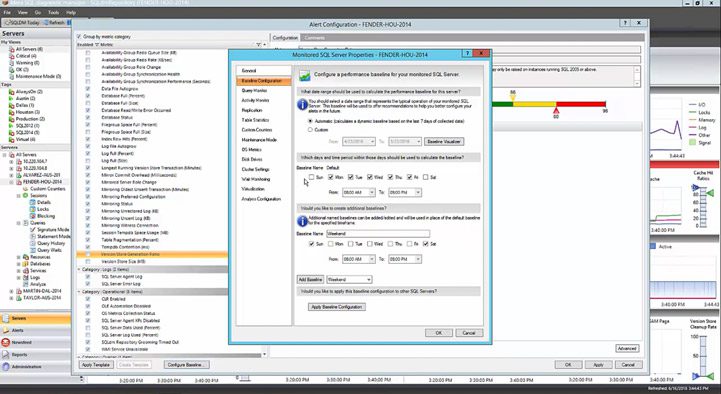
Adjust metric thresholds based on the baseline fluctuations throughout the day. Calculate each baseline out of a pool of collected data based on the selected period and collection interval. Use each baseline to provide alert recommendations to set effective alert thresholds. Visualize times of high and low activity to establish effective baseline periods. Enable alerting and recommendations based on baseline violations. Define and schedule multiple baselines per server. Quickly apply baselines to more than one instance. View the relevant baseline in effect in various metric graphs.
Create multiple baselines for multiple activity windows (such as logins, SSRS report executions, and job activities) for the best baseline accuracy. Metric thresholds change dynamically based on the baseline fluctuations throughout the day, to alert only when current performance jumps excessively outside of normal. The baseline visualizer displays metrics to determine the hot spots during the day, to understand what may be the appropriate time windows to create within the multiple baseline functionality.
Refer also to the documentation Configure server baseline options and Baseline Statistics server analysis report.
Analyze Alert Patterns
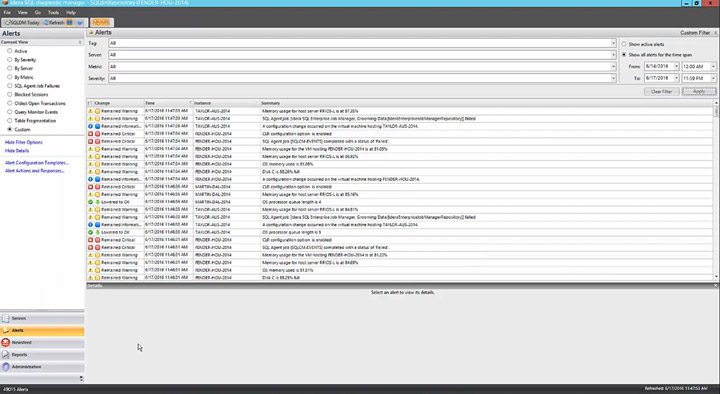
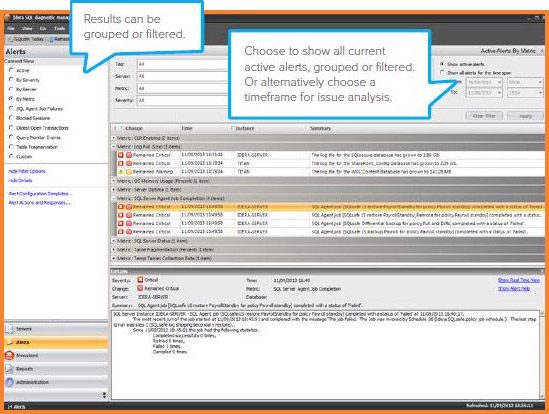
Locate alerts generated over a period. Group and filter the results. Quickly identify and triage alerts and issues before they escalate. Pinpoint groups of alerts that happen over a period. Refer also to the documentation Organize alerts.
Analyze Prescriptively with Expert Recommendations
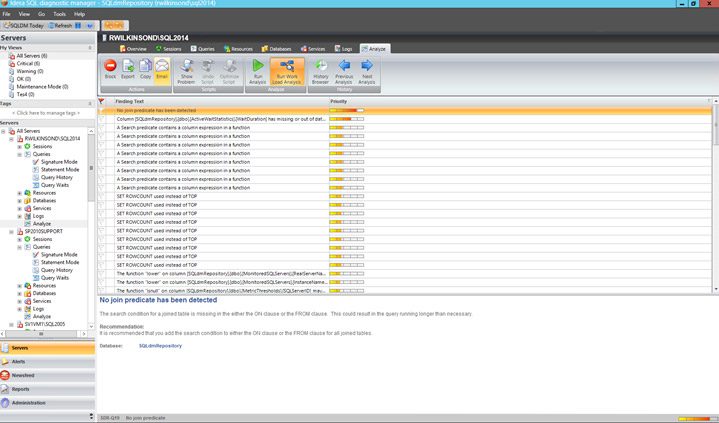
Run a prescriptive analysis on a particular instance to identify and resolve potential SQL Server performance problems. The prescriptive analysis provides quick and minimally invasive analytics of SQL Server instances. The analysis results in a useful set of expert recommendations for improving performance including executable scripts. Prescriptive analysis targets some of the most common areas of SQL Server performance problems, such as workloads, missing indexes, redundant indexes, poor queries, wait states, server configuration, security, database objects, memory, and more. Execute the prescriptive analysis manually, scheduled to run, or launched in response to an alert. Refer also to the documentation Run a prescriptive analysis on your SQL Server.
View Past Performance
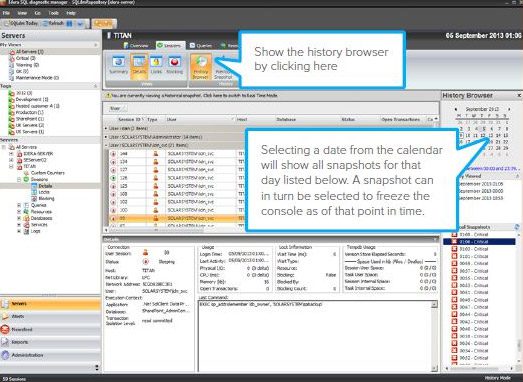
The history browser provides information about the state of SQL Server instances at the time of a standard snapshot. Use this information to diagnose and resolve issues to keep the issue from happening again. Select a historical snapshot collected by the standard refresh and view the collected data using almost all of the real-time views. After choosing a snapshot, replay the data as of that time in the console to select other tabs and view data from all over the tool to correlate issues and fully diagnose problems that have passed. Refer also to the documentation View past performance.
Monitor Tempdb
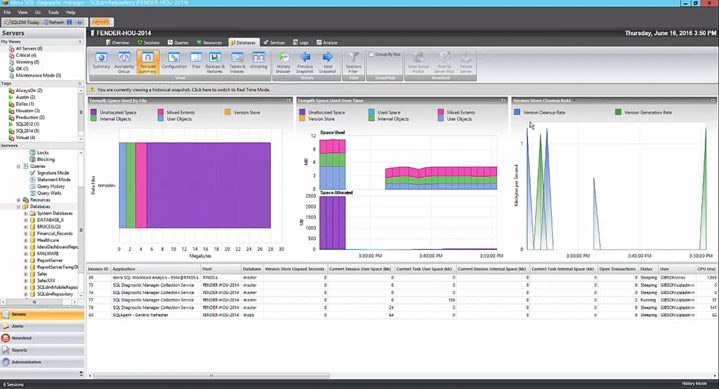
Identify and resolve contention and performance issues with the tempdb system database. Monitor and view the tempdb space and performance related information, including tempdb file space, tempdb version store, tempdb sessions space usage, and waits related to tempdb. See the current capacity usage and recent trends of the files over time. Display a list of sessions currently using tempdb along with their cumulative usage and tempdb space. Refer also to the documentation Tempdb panel, Get the tempdb status summary, and Tempdb Statistics database analysis report.
Plan Future Capacity
The Capacity Usage chart in the Summary view of the Database tab displays the usage of data and logs in the databases. This chart provides information on the text, tables, and indexes space, as well as the unused space of the databases. Refer also to the documentation View your SQL Server databases information.

The Baseline Statistics report analyzes and compares baselines within a single SQL Server instance and across two instances. When viewing baseline statistics for a monitored SQL Server instance, compare the baseline metric values at two different times or two different metrics at the same time. Include another instance and compare baselines values occurring at the same time or different times. View trends in the average value of a metric for a SQL Server instance and how this value changes over time for capacity planning.
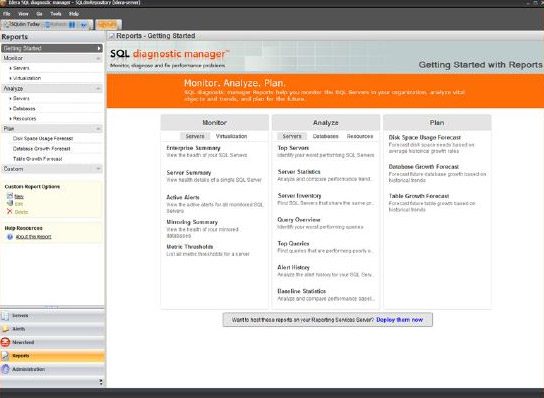
Plan reports to forecast for future needs based on historical growth trends. The Disk Space Usage Forecast report forecasts disk space needs. The Database Growth Forecast report forecasts future database growth. The Table Growth Forecast report forecasts future table growth.
Refer also to the documentation Baseline Statistics server analysis report and Plan reports.
Connect to Other Tools
Connect SQL Diagnostic Manager to other tools. For example, provide in-depth granular diagnostic information to generic management tools currently on the market.
Send Alerts to Other Systems
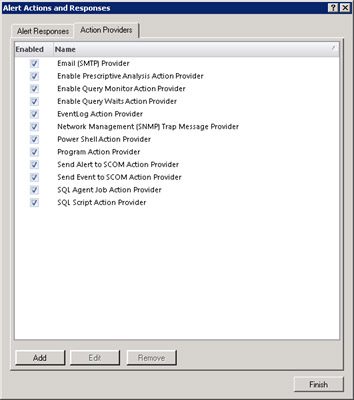
Set up simple network management protocol (SNMP) to send out alert events to other network management systems. SQL Diagnostic Manager includes a management information base (MIB) to use in another network management system to format the events sent by SQL Diagnostic Manager. Add, modify, import, export, and configure alert responses via the Alert Actions and Responses window to send out alert notifications using the email server available on the network with simple mail transfer protocol (SMTP) to issue tracking applications and workflow engines for intelligent routing and automated interaction. Refer also to the documentation Configure network management settings, Understanding the IDERA MIB, and Configure how SQL Diagnostic Manager responds to alerts.
Integrate with SCOM
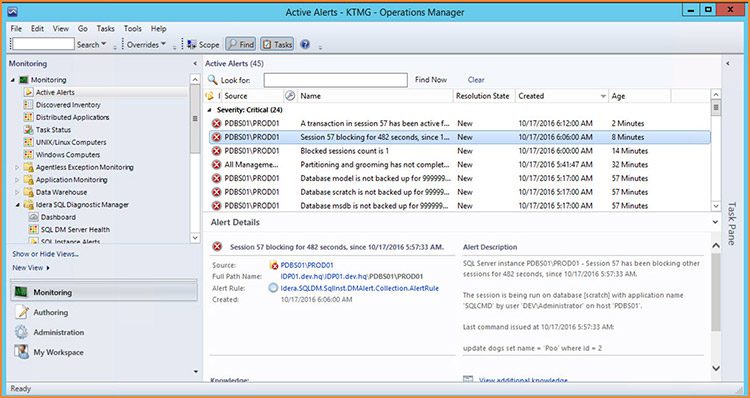
Integrate the detailed alert and status information gathered by SQL Diagnostic Manager into the Microsoft System Center Operations Manager (SCOM) environment. Provide a stream of live updates to IT operators on the status of SQL Server instances being monitored by SQL Diagnostic Manager. Extend management information from SQL Diagnostic Manager to a new custom node within SCOM. Automatic discovery of installations of SQL Diagnostic Manager and of the managed instances from those installations. Once discovered, propagate the status, health, and events of these instances up to SCOM. Refer also to the documentation Integrate SQL Diagnostic Manager with SCOM.
Access Mobile Console
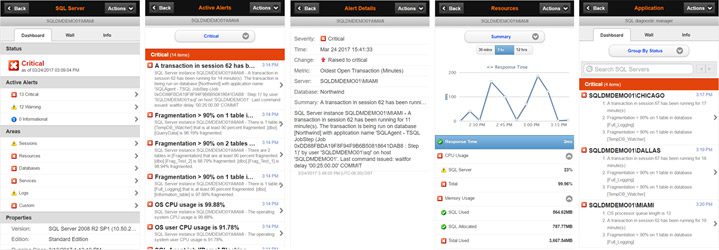
The mobile console is a web-based application that displays SQL Server performance on a variety of mobile devices (including iPhone, iPad, Android, and Blackberry). The mobile console includes the IDERA Newsfeed that is an effective way for database administrators and managers to collaborate, share knowledge, and keep close tabs on the most critical SQL Server issues as they unfold. View real-time dashboards to identify problem areas and get current server health. Drill down into the details of the main performance metrics and alerts. See the entire SQL Server environment, and stay productive and connected from anywhere. Refer also to the documentation Navigate the IDERA Newsfeed and SQLDM Mobile.
Deploy Web-Based Reports via SSRS
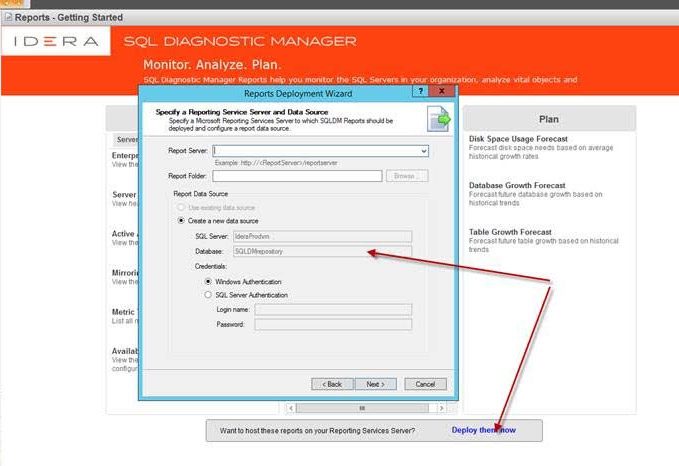
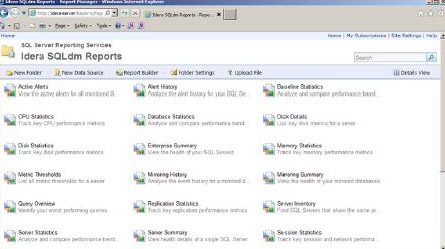
In addition to the included reports, deploy web-based custom reports using SQL Server Reporting Services (SSRS) for a comprehensive auditing solution. Access these web-based reports to analyze current and historical performance and statistical data. Refer also to the documentation Deploy SQL Diagnostic Manager reports to Reporting Services.
Adapt to Specific Needs
Setup Custom Counters
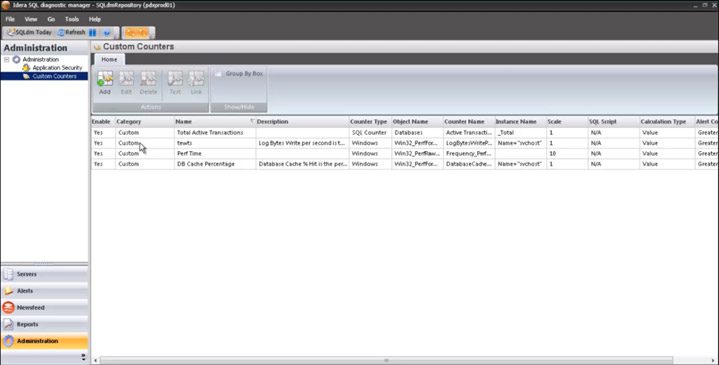
In addition to monitoring a wide variety of the most common SQL Server and operating system performance metrics, add additional performance metrics via custom counters. Add any Windows system counters including any Performance Monitor and Windows Management Instrumentation (WMI) counters. Also, add any SQL Server system counter stored in the sysperfinfo system table, and any numerical value that custom SQL scripts return. Also, add and any performance counters accessible through the virtual machine and host server. Refer also to the documentation Use custom counters to track metrics.
Your content goes here. Edit or remove this text inline or in the module Content settings. You can also style every aspect of this content in the module Design settings and even apply custom CSS to this text in the module Advanced settings.
Create Custom Dashboards
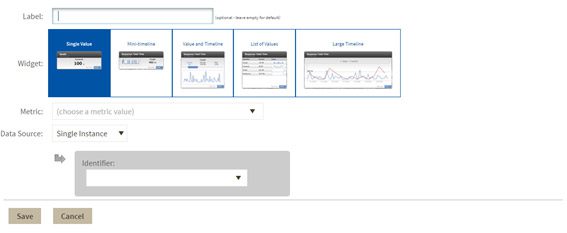
Customize the dashboard per monitored SQL Server instance by selecting the panels that are the most important to display in each instance. Define and save multiple dashboards to compare metrics across monitored SQL Server instances. Customize the dashboard for the selected SQL Server instance or as the default for all added SQL Server instances. Refer also to the documentation Create custom dashboards.
Build Custom Reports
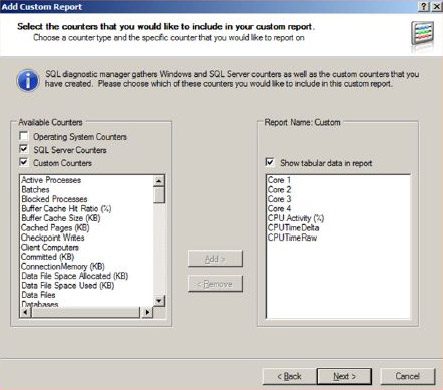
Create or edit custom reports. Include in custom reports any collected metric, including custom counters. Choose the counters to include in a report, order the way the metrics appear, and specify the aggregation method used on each of the metrics. Refer also to the documentation Custom reports.
Audit Activity
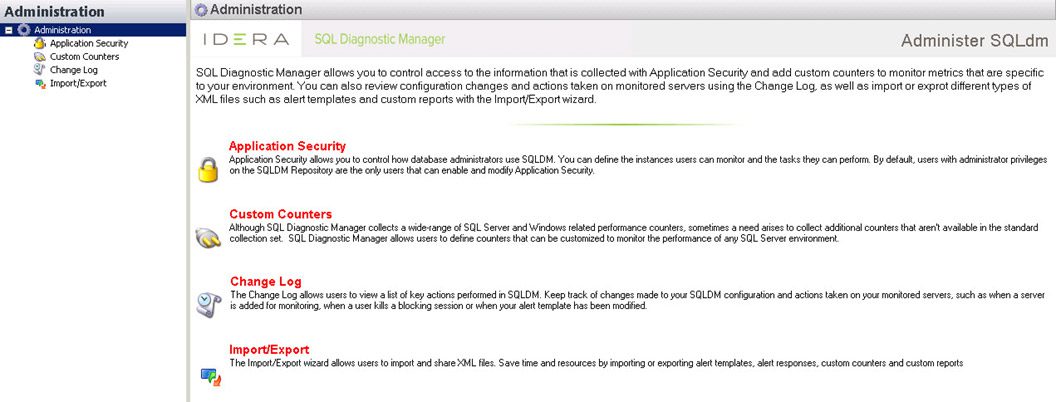
Given the number and different types of users in SQL Server production environments, keeping track of changes to the configuration of SQL Diagnostic Manager is critical. View a list of the main actions performed in the SQL Diagnostic Manager environment (such as when adding a server for monitoring, and changing an alert configuration or grooming configuration). View a thorough and instant list of information on modifications. Refer also to the documentation Use the Change Log to review changes in your SQL Diagnostic Manager configuration.
Manage Large Environments
Scale per each deployment whether monitoring 50, 150, 250, or 350 instances.
Access Multiple Repositories with Desktop Console
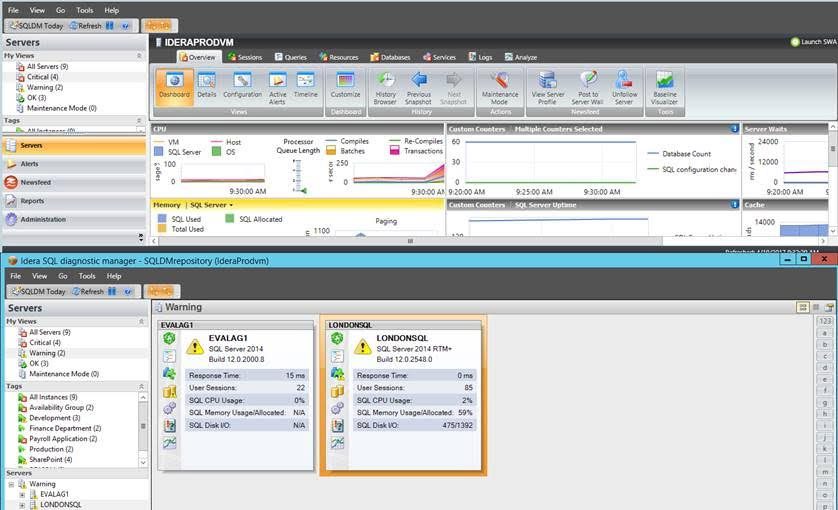
The desktop console is also flexible in its connectivity options. Open the desktop console more than a single time to view data from multiple repository deployments. For example, view two different consoles open together. Refer also to the documentation Monitor instances.
Access Multiple Repositories with Web Console
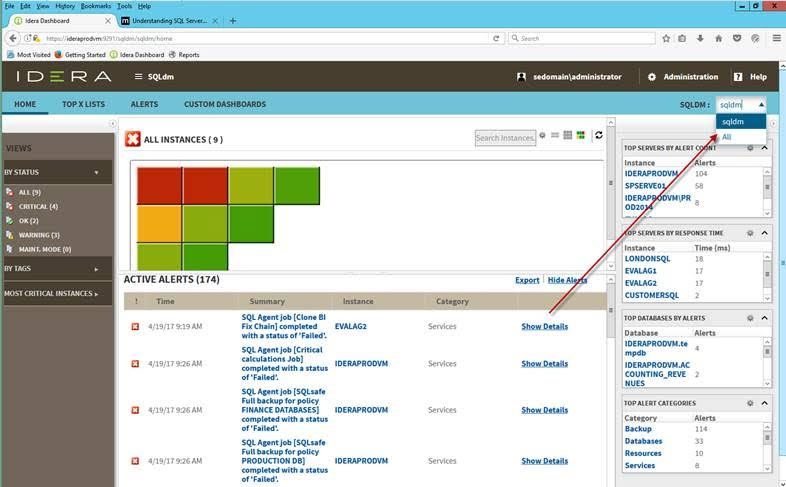
The web console provides additional product scalability and federation of many IDERA products, viewable in a single web browser interface. Attach to multiple deployments to view them as a single enterprise unit. The web console provides much of the same useful data as the desktop console including alerts, heat map, sessions, query activity, query waits over time, query waits by duration, database health, alert timelines, top instances, and custom dashboards. The web console manages selected individual deployments or all instances. Refer also to the documentation Navigate the web console dashboard.
Publish Reports from Multiple Data Sources with SSRS
Deploy and publish the provided reports via the publishing wizard. The publishing wizard creates a data source automatically for whichever repository the console is connected. Through SQL Server Reporting Services (SSRS) folder-based management, generate reports from a single browser interface to span multiple repository data sources. Refer also to the documentation Report on SQL Server Performance.
